• Akira Toriyama passed away

    Let's all commemorate together his legendary work and his impact here

[CEDEC 2022] Playstation keynote: Japan leans more to F2P than any other country, No.1 F2P spend per user, No.2 PS Store spend per user and more

enpleinjour

Member
Enthusiast
Pronouns
He/Him
Wanted to write my long comment about this thread but SIE already disclose some information about japan.


Some important point:
>Japan love F2P, they play more than any other region. (data from month of june 2022 only)
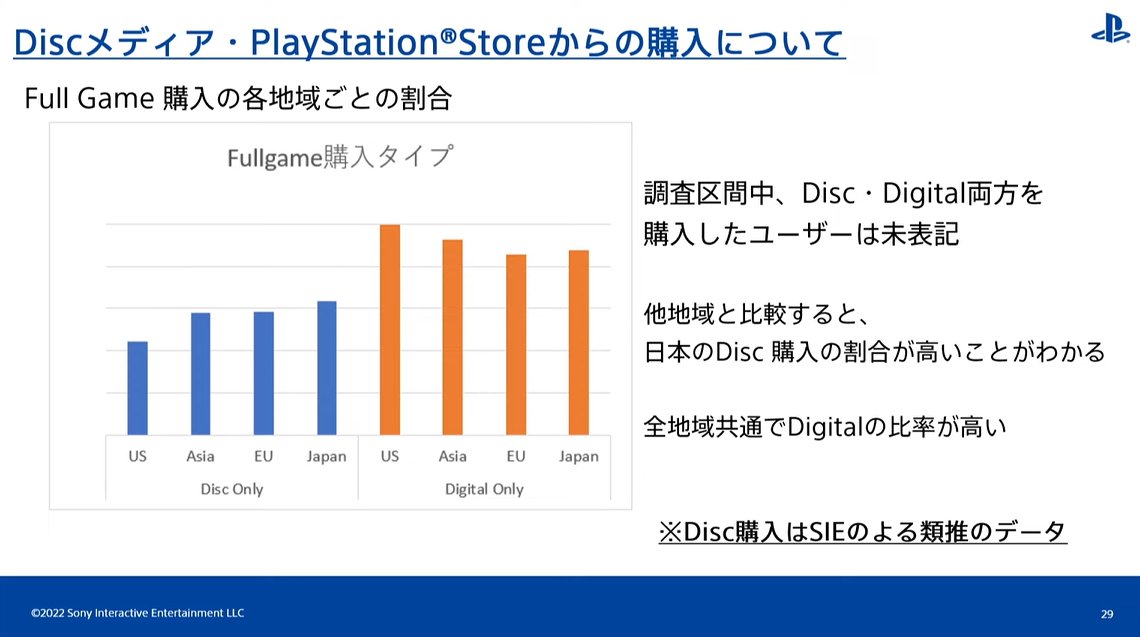
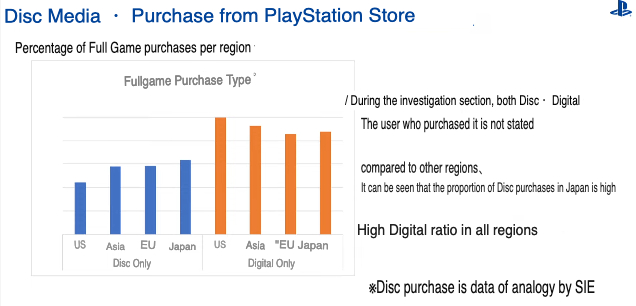
>Japan has the highest Physical Sales (PS4+PS5), 3rd for digital full games (digital sales still higher than physical sales).
>PS5 user spend more in PS Store than PS4 user.
>Overall PS Store spending: 1.US 2. Japan 3.EU 4.Asia.
>Overall spending for Add-On: 1.US 2. Japan 3.EU 4.Asia. Japan average Add-On spending per active device higher than any region.
>F2P spending: 1.Japan 2. US 3.EU 4.Asia
>Japan played the least average number of titles than any other region. US Played the most average number of titles.
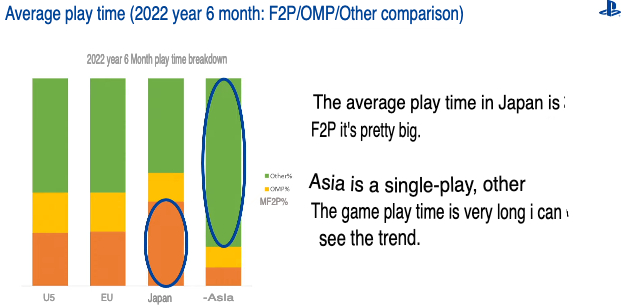
>Average Playtime per title in japan is more than double than any other region (include F2P).
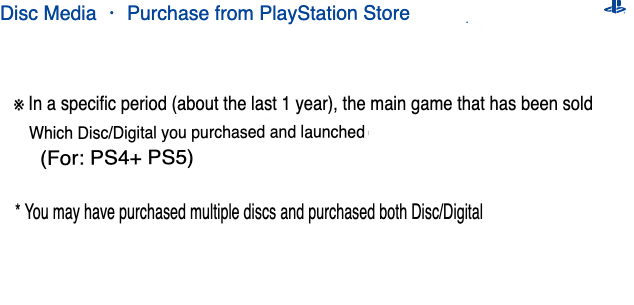
>most data gathered within the last 1 year period of time.

i'm not really good in translating japanese, if there's some mistake, feel free to correct it. Seems like PS User Japan spending just moved from buying physical games into buying more digital games and Add-On (DLC, Season Pass, F2P, etc).


Would be good to get more translation, especially if we get data on digital attach ratio (inc digital only games and excl. digital only games).
  • I'm not too surprised that Japan is No.1 in spend per user in F2P. Apex, Warzone, PUBG, Fortnite, GTA are huge in Japan, maybe even bigger than most B2P games and we all know how accustomed and high spending Japanese mobile gamers are to these monetisation models.
  • Very surprised Japan is No.2 in PS Store spend per user. That's pretty astounding. It means despite EU PS users buying a lot more games, JP users outspend them, presumably through F2P/DLC.
  • Lowest game attach ratio is expected from known sales data.
  • Avg playtime being 2 times more than any region is again pretty astounding. This tells me the F2P/Multiplayer crowd are very dedicated imo.
Anyway, hopefully we can get detailed translations. I think a digital estimate may be possible from some of this data. Thanks @askatmat !
 
Also of important note, Japan's full game digital sales are higher than their full game disc sales.

FbFKrOWaUAEg3L3
 
Also of important note, Japan's full game digital sales are higher than their full game disc sales.

FbFKrOWaUAEg3L3

Is this confirmed to be exclude digital only games? That's pretty huge if that's the case.
Is there any word on if its by revenue or units?
  • Japan digital PS ratio: 58% (from pixel counting)
 
  • Avg playtime being 2 times more than any region is again pretty astounding. This tells me the F2P/Multiplayer crowd are very dedicated imo.
What this tells me first and foremost is that there's virtually zero "casual" audience in Japan to bring those numbers down. Which tracks with what we know about their hardware and software sales in the region.
 
Also of important note, Japan's full game digital sales are higher than their full game disc sales.

FbFKrOWaUAEg3L3
This graph makes no sense whatsoever, be it based on absolute units (sales/players) or percentages so I'm not sure what to take away from it
 
Last edited:
This graph makes no sense whatsoever, be it based on absolute units (sales/players) or percentages so I'm not sure what to take away from it
Google translate says percentages, which makes more sense then something absolute given Japan shouldn’t be above Europe as a whole for PS.

But yeah then something is wrong with the graph. Japan can’t have the highest percentage of physical and still beat another region in digital.
 
This is ratio, and the digital only ratio is between 50-60%.

This is broadly in line with the MC expectation that PS SW sales in Japan are bad even if you "doubled" it's numbers. (Unlike what the narrative some are trying to push with this info)

Also a caveat for this graph. It says
From either Disc Media,or PlayStation Store, means of purchase.

The comparison here is the ratio of DIGITAL ONLY USERs Vs the PHYSICAL ONLY USERS.
The keyword is "Users" and "Only". Users who buy games from both sources are OMMITTED in this chart.

This is why Japan can simultaneously have the higher digital-only ratio than Europe, yet also have highest physical-only ratio in the world. It is simply because more people in Europe fall under the "Both" category, and less in Japan fall under that.

This chart is really just Sony bragging that they have a higher ratio of digital-only users than physical-only users. Other than that it's a not a very useful graph, because a big chunk of "users who use both means" are missing from it, and the Y-axis is missing too so there is not much hard numbers to be had.
 
Last edited:
Sony is a publicly traded, raw data reliably shouldn't be doubted only their interpretation can
PlayStation graphs are generally confusing and useless to look into. You can't trust a company that combined 2 systems into one in order to make it looks good.
 
I'll echo what I said in the PS in Japan thread. This points to a tough environment for the typical Japanese publishers who focused on premium games. Not only are users playing more F2P but they're also playing less games overall for longer which means less chance those users will try your game.

Sure would be nice to know how they define “Full Game”.

In their financial reports they define full game and it does indeed include digital only releases. It basically just excludes expansions, dlc, MTX.

I'd be surprised if they use a different definition here.
 
Sounds terrible for anyone not making a popular premium f2p or GAAS game. In Japan that is.
 
Screen-Shot-2022-08-27-at-2-10-41-PM-translated.jpg


  • MP = 54% of play time
  • F2P = 40%

Screen-Shot-2022-08-27-at-2-11-59-PM-translated.jpg


Screen-Shot-2022-08-27-at-2-13-14-PM-translated.jpg

Digital ratios (eye balling here)
  • US = 69%
  • EU = 60%
  • Asia = 61%
  • Japan = 58%
With these numbers, this suggests it includes digital only games, as Sony's FY reports digital ratio 66% for FY21 (few percentage higher for current FY) and those figures include digital only. I'm assuming this graph is units not revenue as it says purchases.

Whats interesting here is Japan on Playstation has the same digital ratio as EU. We're looking at an avg of 40% for most games.
 
Last edited:
This data is the percentage of users who purchase discs only and digital only.
Users who purchase both discs and digital are excluded.
It is not data on the digital ratio of games.
 
Below is part of what he said on that slide. (Sorry, it is in Japanese.)
---
どのくらいのユーザーさんがディスクまたはPSストアから購入をしているのか、その割合を見ていこうと思います。
今回は調査の条件、前提としまして、直近の約1年間の期間の中で追加コンテンツなどを除くゲーム本編そのものをディスクまたはデジタル、どちらで購入して起動したのか、という条件で調査をしました。
対象はPS4とPS5になります。
また、特定の期間中、数本のゲームを購入しまして、あるゲームはディスクでした、あるゲームはデジタルでしたっていうケースもありますが、今回の調査ではそのデータはグラフから除外しています。
という、前提のもとに見ていただくんですが、こちらが各地域ごとの購入したフルゲームの購入タイプとなっています。
ディスクの情報はSIEによる類推データとなっています。左の青いバーがディスク、右のオレンジのバーがデジタルとなっております。
また、念の為になっておりますが、こちらは本数ではなく、各地域ごとのディスク・デジタルの購入の割合となっております。
先程、除外したと言いました両方購入したユーザーさんもそこそこいらっしゃったんですが、今回はこのどちらかという条件でグラフを作っています。
 
This data is the percentage of users who purchase discs only and digital only.
Users who purchase both discs and digital are excluded.
It is not data on the digital ratio of games.
If Sony is indeed excluding players who purchase both disc and digital games, then all of this data is kinda meaningless.
 
Last edited:
Why is it that I post the explaination for a specific slide yet someone a few posts immediately below makes an amatuer mistake of misinterpreting the slide i just explained. Reading is a lost art in this place.

It literally says on the slide itself. The first statement in black:

"In the scope of the investigation, users who both brought (full games) digitally and physically are NOT SHOWN (in this chart)."

This is why pretend analyst with no language skills shouldn't try to google-translate stuff, you just get high on your own biases because you are guessing what is being said.
 
Last edited:
This data is the percentage of users who purchase discs only and digital only.
Users who purchase both discs and digital are excluded.
It is not data on the digital ratio of games.

The transcript you wrote is more illuminating:

Let's take a look at how many users are purchasing from discs or the PS store. This time, the conditions and premise of the investigation were whether the main game itself, excluding additional content, was purchased and launched on disc or digitally within the last year or so.

The target will be PS4 and PS5. There are also cases where you bought a few games during a certain period of time, some were on disc and some were digital, but we've excluded that data from the charts for this study. With that in mind, here are the purchase types for the full game purchased for each region. The disc information is analogous data by SIE. The blue bar on the left is disc, and the orange bar on the right is digital. Also, just to be sure, this is not the number of units, but the ratio of disc/digital purchases for each region. There were quite a few users who purchased both, which I said I excluded earlier, but this time I'm making a graph with one of these conditions.

So yeah, it seems to be digital only ratio vs physical only ratio.

Maybe I'm overthinking it but wouldn't the fact that Japan has the highest amount of physical only consumers imply that it has the lowest digital ratio for full priced games?

Not necessarily, as people can buy both which are excluded. For instance, if the people that buy both have a greater digital skew on one region, the overall digital ratio can compensate for higher physical only consumers.

We could use these as dependent variables: countries with higher digital only consumers will have high digital ratios, countries with high physical consumers have lower digital ratios, it makes sense, but we don't have the data to support this.

Japan in this graph is pretty close to the EU is somewhat noteworthy.
 
Maybe I'm overthinking it but wouldn't the fact that Japan has the highest amount of physical only consumers imply that it has the lowest digital ratio for full priced games?

Yes. Having the highest amount of physical only customers means you digital buying base (the mixed one + the digital only ones) is necessarily smaller.

However, the data Sony gave says Japan has a higher proportion of digital-only people, as compared to Europe as a whole (but much lower than Asia and US). If you put this all together, it means the people who buy both digitally and physically are relatively less in Japan than EU.

Remember this is the iron rule:
100% - Digital only users - Physical Only users
= % of users who do both.
 
Back
Top Bottom