While Microsoft has refused to update hardware units for the Xbox brand since 2015, that hasn't stopped them from sharing revenue for the brand. Even then, Microsoft doesn't make it easy to figure out how much revenue software and hardware bring in. Thankfully, over the years it has become easier to figure the revenue splits for both and in turn revenue from previous years, going back to 2014.
Technically, this is all math based, BUT you can follow along!
Here is the page to easily go to every quarter. Click the Earnings Call Slides to find the per quarter total revenue. Important places to look for info is the slides, PR, and segment results pages. Do note that starting FY2020 they stop reporting the per quarter revenue. Fortunately they report the amount of revenue the segment goes up or down by.
For example, in FY2021 Q4, Gaming revenue increased $357 million or 11%, Xbox hardware revenue increased 172%, and content and services revenue decreased $128 million or 4%. What you will find is that Microsoft will never give the actual revenue amount for hardware, only the percentage.
And it's kind of just filling in the gaps from there. Go through every quarter and collect every note about YOY increases. Important to note is that the percentages are not exact and will range from .5 to the next .49. So if a percentage of +45% is given, it could be anywhere from 44.50% to 45.49%.
You can check my math for yourself but this is what I get for every quarter dating back to mid 2014. Maybe a quarter can be off by a couple million but it won't be massively off if at all.
FY 2015 (July 2014 - June 2015)
Quarter
Gaming
Content and Services
Hardware
Q1 (Jul-Sep)
$1,990,000,000
$1,097,000,000
$893,000,000
Q2 (Oct-Dec)
$3,529,000,000
$1,353,000,000
$2,176,000,000
Q3 (Jan-Mar)
$1,764,000,000
$1,225,000,000
$539,000,000
Q4 (Apr-Jun)
$1,751,000,000
$1,260,000,000
$491,000,000
Total
$9,034,000,000
$4,935,000,000
$4,099,000,000
FY 2016 (July 2015 - June 2016)
Quarter
Gaming
Content and Services
Hardware
Q1 (Jul-Sep)
$1,996,000,000
$1,255,000,000
$741,000,000
Q2 (Oct-Dec)
$3,721,000,000
$1,741,000,000
$1,980,000,000
Q3 (Jan-Mar)
$1,828,000,000
$1,429,000,000
$399,000,000
Q4 (Apr-Jun)
$1,599,000,000
$1,270,000,000
$329,000,000
Total
$9,144,000,000
$5,695,000,000
$3,449,000,000
FY 2017 (July 2016 - June 2017)
Quarter
Gaming
Content and Services
Hardware
Q1 (Jul-Sep)
$1,886,000,000
$1,336,000,000
$550,000,000
Q2 (Oct-Dec)
$3,617,000,000
$2,063,000,000
$1,554,000,000
Q3 (Jan-Mar)
$1,906,000,000
$1,529,000,000
$377,000,000
Q4 (Apr-Jun)
$1,643,000,000
$1,410,000,000
$233,000,000
Total
$9,052,000,000
$6,338,000,000
$2,714,000,000
FY 2018 (July 2017 - June 2018)
Quarter
Gaming
Content and Services
Hardware
Q1 (Jul-Sep)
$1,896,000,000
$1,611,000,000
$285,000,000
Q2 (Oct-Dec)
$3,920,000,000
$2,145,000,000
$1,775,000,000
Q3 (Jan-Mar)
$2,251,000,000
$1,896,000,000
$355,000,000
Q4 (Apr-Jun)
$2,286,000,000
$1,923,000,000
$363,000,000
Total
$10,353,000,000
$7,575,000,000
$2,778,000,000
FY 2019 (July 2018 - June 2019)
Quarter
Gaming
Content and Services
Hardware
Q1 (Jul-Sep)
$2,738,000,000
$2,184,000,000
$554,000,000
Q2 (Oct-Dec)
$4,232,000,000
$2,802,000,000
$1,430,000,000
Q3 (Jan-Mar)
$2,363,000,000
$2,124,000,000
$239,000,000
Q4 (Apr-Jun)
$2,053,000,000
$1,864,000,000
$189,000,000
Total
$11,386,000,000
$8,974,000,000
$2,412,000,000
FY 2020 (July 2019 - June 2020)
Quarter
Gaming
Content and Services
Hardware
Q1 (Jul-Sep)
$2,542,000,000
$2,176,000,000
$366,000,000
Q2 (Oct-Dec)
$3,327,000,000
$2,507,000,000
$820,000,000
Q3 (Jan-Mar)
$2,349,000,000
$2,157,000,000
$192,000,000
Q4 (Apr-Jun)
$3,357,000,000
$3,075,000,000
$282,000,000
Total
$11,575,000,000
$9,915,000,000
$1,660,000,000
FY 2021 (July 2020 - June 2021)
Quarter
Gaming
Content and Services
Hardware
Q1 (Jul-Sep)
$3,092,000,000
$2,825,000,000
$267,000,000
Q2 (Oct-Dec)
$5,031,000,000
$3,505,000,000
$1,526,000,000
Q3 (Jan-Mar)
$3,533,000,000
$2,896,000,000
$637,000,000
Q4 (Apr-Jun)
$3,714,000,000
$2,947,000,000
$767,000,000
Total
$15,370,000,000
$12,173,000,000
$3,197,000,000
FY 2022 (July 2021 - June 2022)
Quarter
Gaming
Content and Services
Hardware
Q1 (Jul-Sep)
$3,593,000,000
$2,883,000,000
$710,000,000
Q2 (Oct-Dec)
$5,442,000,000
$3,855,000,000
$1,587,000,000
Q3 (Jan-Mar)
$3,740,000,000
$3,015,000,000
$725,000,000
Q4 (Apr-Jun)
$3,455,000,000
$2,770,000,000
$685,000,000
Total
$16,230,000,000
$12,523,000,000
$3,707,000,000
FY 2023 (July 2022 - June 2023)
Quarter
Gaming
Content and Services
Hardware
Q1 (Jul-Sep)
$3,610,000,000
$2,810,000,000
$800,000,000
Q2 (Oct-Dec)
$4,758,000,000
$3,380,000,000
$1,378,000,000
Q3 (Jan-Mar)
$3,607,000,000
$3,100,000,000
$507,000,000
Q4 (Apr-Jun)
$3,491,000,000
$2,896,000,000
$595,000,000
Total
$15,466,000,000
$12,186,000,000
$3,280,000,000
FY 2024 (July 2023 - June 2024)
Quarter
Gaming
Content and Services
Hardware
Q1 (Jul-Sep)
$3,919,000,000
$3,175,000,000
$744,000,000
Q2 (Oct-Dec)
Q3 (Jan-Mar)
Q4 (Apr-Jun)
Total
Graph
If you want something on hardware units (and I know you do why are you on this site in the first place) look below. I want the OP to remain as clean as possible.
But wait! Couldn't we further math out hardware shipments if we know the revenue? Yeah. We would just need to figure out a good estimate for the Average Sale Price for each quarter.
We also need to clear up whether or not accessories like controllers are included in hardware revenue. I'll try to prove they aren't.
Firstly, you yourself can go through every single quarter for the past 8 years. Go find me a single mention of accessories whenever Microsoft talks about hardware. You won't find any mention of controllers like the Elite having an impact on revenue for a quarter, but what Microsoft does make note of, and only makes a note of, is whether or not Xbox hardware revenue is impacted by console unit sales going up or down, along with ASP going up or down. The only mentions regarding hardware for 8 years of reporting only refer to consoles. Never accessories.
Secondly, we can use the revenue we math'd out with known Xbox hardware unit sales Microsoft reported on in 2014/2015. These were combined Xbox 360 and Xbox One shipments but since we have a revenue number to work with and we have a general idea of what each console was selling for, if we can clear those out we will see if there's any money left over for non console revenue. Here's what I mean.
Official reported Xbox hardware shipments 2014 - 2015
Jul-Sep 2014: 2.4M
Oct-Dec 2014: 6.6M
Jan-Mar 2015: 1.6M
Apr-Jun 2015: 1.4M
Do note that for the fiscal year Microsoft reported 12.1M shipments so some or all quarters here are not exactly 2,400,000 for example.
The easiest quarter to work out is Jul-Sep 2014 as that is before the big US price cut to $349 in November. The vast majority of Xbox One's are going to be the $399 Xbox One. Something in the range of 70-80% as even though the $399 XB1 should have been a massive seller killing the Kinect SKU, we have a leak from the June 2014 NPD that shows only 55% of XB1 sales were from the $399 SKU, and the Kinect SKU wasn't even impacted negatively by its introduction. Over the next three months though there would be massive Fall releases like Madden (which had a successful $399 bundle) and Destiny which should've been pushing the lower priced SKU more.
Using a range of 70-80% $399 Xbox One's is an ASP of $420-$430.
The Xbox 360 is a bit harder to pin down but by September 2014 Microsoft was selling Kinect bundles and a 500GB bundle at $249. The $199 4GB should've stayed the same and any 250GB bundles would match the Kinect price until the 500GB SKU releases. So I dunno, $220 as an ASP? Lower if the 4GB is what's popular in 2014?
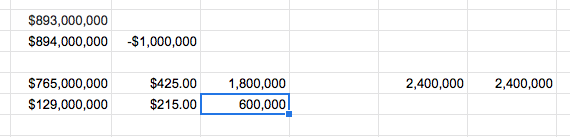
We could just do it now. ~2,400,000 hardware units were shipped and generated ~$893,000,000 in revenue.
Very quickly I end up at the following.
Xbox One: 1,800,000 * $425 = $765,000,000
Xbox 360: 600,000 * $220 = $132,000,000
Total: 2,400,000 = $897,000,000
And that's OVER the $893M
It being THAT close immediately just means there's some slight adjustments that need to be done to the ASP of each console and it hits all 100% of the hardware revenue. Quite simply, controllers, headsets and the like can not fit into hardware revenue. Microsoft has never made any mention of them when reporting what impacted hardware revenue and we just quickly math'd out console shipments taking up every dollar.
You can work this math out too if you still disagree. Just remember the following:
You need to hit 2,400,000 or slightly above combined XB1 and 360 units.
Xbox One SKU's at the time were $399 No Kinect and $499 Kinect
Xbox 360 SKU's at the time were ~$250 Kinect and 500GB bundle, possibly ~$200 4GB.
Like, even if you just use $400 and $200, 2.1M XB1 and 300K 360 is $900,000,000. All hardware is console revenue only.
Hmm you might really be right, that accessories are not included in hardware.
It's for sure not in games and service revenue, and equally sure is in the More Personal Computing Division.
The last FY Microsofts MPC Division made $54.093bn
Windows, Gaming, Search advertising and Devices had a combined $53.647bn revenue from external customers.
Devices is $6.791bn, Surface is $6.478bn and Devices is explicitly mentioned to include PC accessories
That leaves the "other" Product and Service category of $4.479bn, where accessories could be accounted for. But it could also be inter-division revenue responsible for the small gap of $0.5bn or just accounting.
That would make the Xbox division a little bigger than just the $15.370bn. It's really hard to figure out for certain.
So for 5 quarters we have an easy enough job of knowing exactly how many units were sold, we just need to figure out the split between Xbox 360 and XB1. We can do that through ASP estimating like we did in a previous post. To keep it easy to follow along for yourself since we are all using the same info, here's I'm setting this up.
Go into Google Sheets or Excel or whatever you use and just do something like this
The higher numbers are the Known Revenue (Top), Calculated Revenue from the lower numbers (Bottom), and the difference between the Top and Bottom (Right).
The lower numbers on the left are the Calculated Revenue from ASP and Units (Left), ASP (Center), and Units (Right). The numbers on the right are for the 5 quarters with known numbers and are meant to be a guide to make sure we are reaching the total. After the Xbox 360 is gone we will still need a total as we will try to estimate Xbox One S and X when they come along.
It would take literal hours to have to explain every single quarter in detail so only for those that absolutely need it, I'm going to try and provide basic info and math with results. Also for easiness I'm going to table these in calendar year, not fiscal year. Also note that every PR from MS Financials compares Year over Year.
And REMEMBER these are merely estimates. The revenue isn't going to be exact. Microsoft rounds to the nearest million. Units aren't uber accurate. They aren't meant to be some psychic look into Phil Spencer's spreadsheets. These are Welfare Estimates.
2014
Quarter
Xbox 360
Xbox One
Notes
Q1 (Jan-Mar)
800,000
1,200,000
Known Official Numbers
Q2 (Apr-Jun)
600,000
500,000
[1] / 1.1M Combined
Q3 (Jul-Sep)
600,000
1,800,000
[2] / 2.4M Combined / XB1 +28 markets
Q4 (Oct-Dec)
1,450,000
5,160,000
[3] / 6.6M Combined / XB1 Price Cut
Total (Life To Date)
3,550,000 (86,450,000)
8,660,000 (12,560,000)
[1] Immediately and I might have a aneurysm on this one.
Basically Amy Hood, the executive vice president and chief financial officer, said that Microsoft would be working clearing out existing inventory of Xbox hardware. Xbox One at the end of 2013 had a confirmed 900,000 units unsold (3M sell through / 3.9M shipped) and by the end of March 2014 the best estimate would put XB1 at another 900,000 units unsold (~4.2M sell through / 5.1M shipped).
Thanks to NPD leaks from June 2014 we know the $399 SKU only sold 108K units, meaning the $499 Kinect sold 281K total in Q2. That would be ~470K total worldwide following trends at the time, meaning the unsold units purely from end of March 2014 would drop to ~430K. Considering it took 3 whole months to move ~470K (~36K a week) it would take a further 11 weeks to sell out remaining Kinect units. Needing to ship anymore Kinect units seems unnecessary for Q2.
That leaves the only Xbox One thing that would be shipped is the $399 SKU, and as I said it sold through 108K in the US in June 2014. Now obviously shipments are going to be higher than that, probably have to account for another month's worth since Microsoft and retailers probably expected big things out of the price cut.
XB1 in total ($399 + $499) would sell 131K in July. Let's just say that's the extra shipments in June and put the US shipment of the $399 SKU at ~240K. US was ~60% of worldwide sales at the time so that's an easy extrapolation to 400K exactly.
Now that might seem absurd to you. Only 400K XB1 compared to 700K 360's? Why would Microsoft ship so many 360's? Well, all I can comment on is that XB1 sell through was dreadful in 2014 and the Amy Hood quote above would be most relevant to XB1. Maybe Microsoft shipped ~100K XB1 Kinect's at the beginning of April then stopped and the total is ~500K? Possible. Another possible reason this is correct is because, maybe Xbox 360 shipping more than XB1 was exactly the reason Microsoft started hiding numbers.
[2] This is easier to explain since I did it in this post here. I'll further elaborate and say the ASP I used was XB1: $425 / 360: $214 which equaled $893,400,000 ($400,000 "off" as the revenue is rounded to the millions)
[3] You are going to have to trust me on this but I remember Microsoft saying somewhere that Xbox One sold 10 Million units on December 3 yet I can't find it!
Xbox 360 ASP is going to be below $200 considering some Black Friday sales were $179 or $99 4GB depending on the retailer. Worldwide I'm not sure how drastic the cuts were so we could keep put 360 something at $180-$190 ASP this quarter.
Xbox One had a ton of SKU variety along with a US price cut to $349 in November and a further $329 Black Friday price. Now, this wouldn't mean the ASP is going to be ~$349 worldwide. Other regions would obviously have deals but if we were to estimate a US ASP, we might have to lob on a few extra dollars as insurance.
Basically even with the $329 deal for Black Friday, the COD and Kinect bundle should have kept the ASP a bit over $349. Like $360-$370, then with worldwide we'll add on an extra $10, so $370-$380
I came to the following ASP. XB1: $370 / 360: $184 which equaled $2,176,000,000 ($0 "off" as the revenue is rounded to the millions). Remember from an earlier post that FY 2015 shipments equaled 12.1M, so we have some wiggle room to do something like XB1 5.16M
2015
Quarter
Xbox 360
Xbox One
Notes
Q1 (Jan-Mar)
450,000
1,170,000
[4] / 1.6M Combined
Q2 (Apr-Jun)
200,000
1,230,000
[5] / 1.4M Combined
Q3 (Jul-Sep)
190,000
1,900,000
[6]
Q4 (Oct-Dec)
440,000
5,370,000
[7]
Total (Life To Date)
1,280,000 (87,730,000)
9,670,000 (22,130,000)
[4] Taken from here, "driven by a 20% decline in console volume and lower prices of Xbox One consoles compared to the prior year.". So total hardware units are down along with Xbox One ASP. Could mean both Xbox 360 and XB1 are down in units, or that only the 360 is down but XB1 didn't increase.
In the US, XB1 stayed at its $349 base price. This is a massive drop from the $499 of 2014. Xbox 360 should've just gone back up to what it was selling before Q4 2014, so around that $210-$220 range.
I came to the following ASP. XB1: $378 / 360: $215 which equaled $539,010,000 ($10,000 "off" as the revenue is rounded to the millions). I just reused the Q4 ASP for XB1 since the lower sales of the Kinect and COD bundles would be countered by the increase in price worldwide in a non holiday quarter. I also just made sure XB1 was slightly down in units.
[5] Taken from here, "driven by higher volumes of consoles sold, offset in part by lower prices of Xbox Ones sold.". Makes sense since the base price is now $349, even with the introduction of a new 1TB model at $399 in June. The UK also saw a £30 price cut, along with the general slow down of Kinect sales in 2015, the ASP of XB1 should be approaching closer to $349. Maybe like $360. Xbox 360 should be around the same.
I came to the following ASP. XB1: $365 / 360: $210 which equaled $490,950,000 ($50,000 "off" as the revenue is rounded to the millions).
[6] Taken from here, "Xbox hardware revenue decreased 17%, mainly due to lower volumes of Xbox 360 consoles sold." If the reason for revenue decline was Xbox 360 units, that should mean Xbox One is either flat at worst or even up YOY. ASP should be well down from 2014 Q3 so it's actually highly likely Xbox One is up in units.
A "spoiler" but for the Fiscal Year 2016 (July 2015 - June 2016) Microsoft reported Xbox One was up in units.
There were some more $399 bundles released so the ASP should increase slightly. Xbox 360 could be going down in ASP as the year goes on. Less stock but in general way lower base demand at standard prices as 8th gen gets into high gear and retailers want to clear inventory.
I came to the following ASP. XB1: $370 / 360: $200 which equaled $741,000,000 ($0 "off" as the revenue is rounded to the millions).
[7] Taken from here, "Xbox One revenue decreased slightly, due to higher console volume, offset by lower prices of consoles sold." I calculated Xbox One revenue to be $1,909,200,000 so we just have to get nit picky on what "slightly" means. Personally I take it to mean <$10M, so still above $1,900,000,000.
Now because Xbox One is determined by itself, it's pretty important to the the Xbox 360 as that will be the remainder. To keep the number from being massively inflated (like +500K) that's how I came to my Xbox One estimates for 2014.
In Q4, XB1 was available at $299 during Black Friday and Christmas shopping which would help bring ASP down from 2014. There were still plenty of new $399 bundle along with the introduction of new $499 options such as the Halo 5 Bundle, Elite, and another Kinect bundle. Every Xbox One would receive a price cut during the holidays so the ASP should be well below the ~$380 it was last year. Xbox 360 should be massively discounted going by 2014 but I can't find deals. Since the 360 is near dead in 2016 I'm assuming even bigger drops in ASP this holiday.
I came to the following ASP. XB1: $355 / 360: $168 which equaled $1,980,270,000 ($270,000 "off" as the revenue is rounded to the millions).
2016
Quarter
Xbox 360
Xbox One
Notes
Q1 (Jan-Mar)
60,000
1,080,000
[8]
Q2 (Apr-Jun)
30,000
1,020,000
[9] / Xbox 360 Discontinued
Q3 (Jul-Sep)
0
1,810,000
[10]
Q4 (Oct-Dec)
0
5,340,000
[11]
Total (Life To Date)
90,000 (87,820,000)
9,250,000 (31,380,000)
[8] Taken from here, "Xbox hardware revenue decreased 26%, mainly due to a decline in Xbox 360 console volume and lower prices of Xbox One consoles sold." Now because they mention Xbox 360 volume (units) and XB1 prices (ASP) being the main reason for the decline in revenue, XB1 units should be flat or slightly down at worst.
Xbox One ASP is confirmed down and should actually be close to $349 as March saw a quick $299 price promotion. Above Q4 ASP due to length of price cuts but still below Q1 2015.
Xbox 360 should just be considered dead at this point and retailers should be pushing the price down to get rid of inventory left over. Low ASP probably near holiday prices.
I came to the following ASP. XB1: $359 / 360: $185 which equaled $398,820,000 ($180,000 "off" as the revenue is rounded to the millions).
[9] Taken from here, the fiscal year result is "Xbox hardware revenue decreased 16%, mainly due to lower prices of Xbox One consoles sold and a decline in Xbox 360 console volume, offset in part by higher Xbox One console volume." Xbox One FY 2016 is higher than FY 2015.
Taken from here, the quarter result is "Xbox hardware revenue decreased 33%, mainly due to a decline in consoles sold and lower prices of consoles sold." So in general the decline in XB1 units this quarter should be bigger than I've been calculating before.
April 20, 2016: Xbox 360 manufacturing discontinued Source
Now Q2 is a big quarter in that Xbox just went "Fuck this" and dropped the prices super low in June. 500GB and Kinect bundles were $279 and the 1TB was $299. April had continued the March price promo so really only May sales would keep up the ASP above $300.
Xbox 360 is almost meaningless at this point. Microsoft doesn't even to bother mention it as a reason for declining revenue.
I came to the following ASP. XB1: $317 / 360: $175 which equaled $328,590,000 ($410,000 "off" as the revenue is rounded to the millions).
[10] Taken from here, "Xbox hardware revenue decreased 26%, mainly due to lower prices of consoles sold and a decline in volume of consoles sold." No question, Xbox One is down YOY. Xbox 360 shipments should be dead since manufacturing ended in April.
The Xbox One S launched at $299, $349, and a limited $399. The Xbox One also went even lower to $249 in July. We also had ASP leaks for NPD for this quarter that lead to revenue looking like this: Q3 Revenue = ~$234,760,000 and with units that leads to the following ASP of $301. Pretty easy that one huh?
I came to the following ASP. XB1: $304 which equaled $550,240,000 ($240,000 "off" as the revenue is rounded to the millions).
[11] Taken from here, "Xbox hardware revenue decreased 22%, mainly due to lower prices of consoles sold and a decline in volume of consoles sold." All this points to is Xbox One 2016 is lower than the combined Xbox 360 + Xbox One 2015. Could even be up YOY.
We had an ASP leak for October but it won't matter as much since November and December had massive $249 deals. ASP should be in the $280-$290 range as the 1TB bundles were still popular at $349 and then $299.
I came to the following ASP. XB1: $291 which equaled $1,553,940,000 ($60,000 "off" as the revenue is rounded to the millions).
2017
Quarter
Xbox One
Notes
Q1 (Jan-Mar)
1,190,000
[12]
Q2 (Apr-Jun)
730,000
[13]
Q3 (Jul-Sep)
940,000
[14]
Q4 (Oct-Dec)
5,400,000
[15]
Total (Life To Date)
8,260,000 (39,640,000)
[12] This quarter Microsoft decided to just not say anything about hardware. Seeing the revenue, it wasn't anything to note. It would be weird to not mention Xbox hardware units are up YOY as even with an ASP of $350 (impossible) Xbox would still be up YOY.
There was another $50 cut. Not really much else to say other than ASP should be in a range of $300-$320 depending how high sales spiked during the promotions.
I came to the following ASP. XB1: $317 which equaled $377,230,000 ($230,000 "off" as the revenue is rounded to the millions).
[13] Taken from here, the fiscal year result is "Xbox hardware revenue decreased 21%, mainly due to lower prices of consoles sold and a decline in volume of consoles sold." Xbox FY 2017 is lower than FY 2016.
Taken from here, the quarter result is "Xbox hardware revenue decreased 29%, driven by lower prices and a decline in volume of consoles sold." No idea why they mention hardware now. This is the worst quarter!
There was certainly a price promotion in June but because of the announcement of the Xbox One X the One S just stagnates. The ASP shouldn't be that different from the last quarter.
I came to the following ASP. XB1: $319 which equaled $232,870,000 ($130,000 "off" as the revenue is rounded to the millions).
[14] Taken from here, "Xbox hardware revenue decreased 48%, mainly due to a decline in volume of consoles sold and lower prices of consoles sold." It was around here that the 500GB went down to $279. Will lower the ASP a bit but it shouldn't be much. Other than that nothing happened.
I came to the following ASP. XB1: $303 which equaled $284,820,000 ($180,000 "off" as the revenue is rounded to the millions).
[15] Taken from here, "Xbox hardware revenue increased 14%, primarily due to the launch of Xbox One X." Xbox One X was $499 which would represent a massive ASP spike.
There was a leak for Xbox One X NPD November that put it over 430K. This holiday is also when Xbox One S would go below $200. At this point the ASP guessing is going to be hard as now the One X is going to have a big impact. In general, over the years, it's been assumed the One X averaged ~30% of sales after launch.
I came to the following ASP. XB1: $329 which equaled $1,775,000,000 ($0 "off" as the revenue is rounded to the millions). I estimate 1.7M X's were shipped.
2018
Quarter
Xbox One
Notes
Q1 (Jan-Mar)
1,040,000
[16]
Q2 (Apr-Jun)
1,110,000
[17]
Q3 (Jul-Sep)
1,640,000
[18]
Q4 (Oct-Dec)
5,090,000
[19]
Total (Life To Date)
8,880,000 (48,520,000)
[16] Literally nothing on hardware. Ugh
There were some $229/$249 deals on the S. Around here is where I feel the 500GB falls in favor of the 1TB as the PUBG and Sea of Thieves bundle were that. The X saw some love where for two weeks you could PUBG or Sea of Thieves free.
I came to the following ASP. XB1: $341 which equaled $354,980,000 ($20,000 "off" as the revenue is rounded to the millions).
[17] Literally nothing on hardware, again. At this point PUBG and Fortnite were so strong for Xbox they were driving growth alone.
This quarter saw the first Xbox One X promo to $449 and steeper One S cuts to $199 for the 500GB. ASP will be lower than Q1 and in turn higher units since revenue actually increased quarter over quarter.
I came to the following ASP. XB1: $327 which equaled $363,270,000 ($270,000 "off" as the revenue is rounded to the millions).
[18] Taken from here, "Xbox hardware revenue growth of 94%, against a low prior year comparable due to timing of the Xbox One X launch in the second quarter of fiscal year 2018." Nothing from this other than everything is up.
No price cuts this quarter so everything should be near MSRP.
I came to the following ASP. XB1: $338 which equaled $553,760,000 ($240,000 "off" as the revenue is rounded to the millions).
[19] Taken from here, "...offset in part by a decline in Xbox hardware of 19% due to the launch of Xbox One X in the second quarter of fiscal year 2018."
There were massive sales again this holiday going back to $199 and the One X was on sale for $399 for the entirety of Black Friday week through December.
I came to the following ASP. XB1: $281 which equaled $1,430,150,000 ($150,000 "off" as the revenue is rounded to the millions).
2019
Quarter
Xbox One
Notes
Q1 (Jan-Mar)
710,000
[20]
Q2 (Apr-Jun)
580,000
[21]
Q3 (Jul-Sep)
1,120,000
[22]
Q4 (Oct-Dec)
3,490,000
[23]
Total (Life To Date)
5,900,000 (54,420,000)
[20] Taken from here, "...offset in part by a decline in Xbox hardware of 33% primarily due to a decrease in volume of consoles sold." Nothing on lower prices so the ASP should be similar to last year or the units drop is massive the lower prices didn't matter as much.
The One X went to $399 in February with the Fallout 76 bundle. Only that bundle as others were still $499. The One S went to $249 a couple of times but never went as low as it did in 2018.
I came to the following ASP. XB1: $337 which equaled $239,080,000 ($80,000 "off" as the revenue is rounded to the millions).
[21] Taken from here, the fiscal year result is "...offset in part by a decline in Xbox hardware of 13% primarily due to a decrease in volume of consoles sold." So units are down from last fiscal year.
Taken from here, the quarter result is "Xbox hardware revenue declined 48%, primarily due to a decrease in volume of consoles sold." Units down from last year.
This quarter saw the release of the Xbox One S All Digital Edition at $249, but it was a limited release in the US that wouldn't expand until the holidays and no mention was made of it here so it shouldn't have had much impact. There were some price cuts but sales at this point weren't getting boosted by them.
I came to the following ASP. XB1: $325 which equaled $188,750,000 ($250,000 "off" as the revenue is rounded to the millions).
[22] Taken from here, "...driven by a decrease in Xbox hardware of 34%, primarily due to a decrease in volume of consoles sold." Units down again.
There was one week of a price cut but it was nothing, really. I think the Fallout bundle deal ended here so that should be $499 again. Everything should be close to MSRP.
I came to the following ASP. XB1: $327 which equaled $366,320,000 ($320,000 "off" as the revenue is rounded to the millions).
[23] Taken from here, "Xbox hardware revenue decreased 43%, primarily due to a decrease in volume and price of consoles sold." So ASP and units are down big time.
The SAD hit $149, One S $199, and One X $349. The SAD was also really popular this holiday.
I came to the following ASP. XB1: $235 which equaled $819,790,000 ($210,000 "off" as the revenue is rounded to the millions).
2020
Quarter
Xbox One
Xbox Series
Note
Q1 (Jan-Mar)
680,000
0
[24]
Q2 (Apr-Jun)
1,050,000
0
[25]
Q3 (Jul-Sep)
890,000
0
[26]
Q4 (Oct-Dec)
300,000
3,190,000
[27]
Total (Life To Date)
2,920,000 (57,340,000)
3,190,000
[24] Taken from here, "Xbox hardware revenue decreased 20%, primarily due to a decrease in price of consoles sold." So ASP went down while units not so much.
Now, this March is the start of the Covid 19 pandemic. Mid March is when the shit really hits and consoles start selling out. MS found it smart to also give the One X a permanent price drop to $399 after having a $299 promo in February.
I came to the following ASP. XB1: $283 which equaled $192,480,000 ($480,000 "off" as the revenue is rounded to the millions).
[25] Taken from here, the fiscal year result is "Xbox hardware revenue declined 31%, primarily due to a decrease in volume and price of consoles sold."
Taken from here, the quarter result is "Xbox hardware revenue increased 49%, primarily due to an increase in volume of consoles sold." Xbox is up from last year. This is thanks entirely to the pandemic.
The Xbox One X was pretty much sold at $299 this entire quarter and on June 5 the SAD went to $199 while supplies lasted. This would also be the last quarter the One X and SAD were shipped as only the One S was the remaining unit selling after June.
I came to the following ASP. XB1: $269 which equaled $282,000,000 ($0 "off" as the revenue is rounded to the millions).
[26] Taken from here, "Xbox hardware revenue declined 27%, driven by a decrease in volume of consoles sold ahead of new console launches."
The only thing shipped this quarter was the $299 Xbox One S. This is pretty easy to calculate.
I came to the following ASP. XB1: $300 which equaled $267,000,000 ($0 "off" as the revenue is rounded to the millions).
[27] Taken from here, "Xbox hardware revenue increased 86%, driven by higher price of consoles sold due to the Xbox Series X|S launches." Basically the ASP being higher is the reason for an increase.
Now here's a complicated quarter. What did Xbox Series ship? We have an idea. Leaks put XBS at 1.5M sold through in the US. Because of the pandemic, everything was (and is still) sold out. We also know XBS sales for all of January were only slightly over 100K. We can reasonably put US shipments in 2020 as 1.55M - 1.6M.
Ampere Analytics put XBS at 2.8M sold through in 2020 here, and following known lead times on shipments can be a few weeks off (PS4/5 had a 300,000 difference in sell through and shipments despite being sold out), we can assume total shipments of XBS exceed 3M and maybe slightly more.
Xbox Series has two SKU, the $499 X and $299 S. The split between both is assumed to be in the 70-80:30-20 range at this point, favoring the X.
I'm assuming a ~75:25 split for XBS this quarter leading to 2,400,000 X and 790,000 S which equaled $1,437,000,000 and the remaining revenue is Xbox One S.
2021
Quarter
Xbox One
Xbox Series
Notes
Q1 (Jan-Mar)
30,000
1,460,000
[28]
Q2 (Apr-Jun)
30,000
1,800,000
[29]
Q3 (Jul-Sep)
0
1,900,000
Q4 (Oct-Dec)
0
4,410,000
Total (Life To Date)
60,000 (57,400,000)
9,570,000 (12,760,000)
[28] Taken from here, "Xbox hardware revenue increased 232%, driven by higher price and volume of consoles sold due to the Xbox Series X|S launches."
This is the highest quarter revenue for hardware on record (going back to FY 2015).
From Ampere Analysis (here), XBS is estimated to have done ~1.2M sell through worldwide, LTD of ~4M. US sales are estimated somewhere in the ~500K-600K range from limited info. It's still sold out in this quarter so shipments wouldn't be much higher. This quarter is when the S started to become more available so I'll bump its share of the pie.
Xbox One has been dead at retail since December 2020. Nowhere is it being sold in any meaningful amount and really even 10K might be too much.
I'm assuming a ~65:35 split for XBS this quarter leading to 950,000 X and 510,000 S which equaled $628,000,000 and the remaining revenue is Xbox One S.
[29] Taken from here, the fiscal year result is "Xbox hardware revenue increased 92% driven by higher price of consoles sold due to the Xbox Series X|S launches."
Taken from here, the quarter result is "Xbox hardware revenue increased 172% driven by higher price and volume of consoles sold due to the Xbox Series X|S launches."
Microsoft also announced Xbox Series is the fastest selling Xbox ever (here). Here are the other Xbox consoles after 3 quarters:
Xbox: 3,900,000
Xbox 360: 5,000,000
Xbox One: ~5,500,000
From Ampere Analysis (here), XBS is estimated to have done ~1.35M sell through worldwide, LTD of ~5.3M. US sales are estimated somewhere in the ~600K-700K range from limited info.
Series S again became more available than the X and is starting to become a trend that the X is taking up less and less of the total share.
I'm assuming a ~60:40 split for XBS this quarter leading to 1,090,000 X and 710,000 S which equaled $758,000,000 and the remaining revenue is Xbox One S.
Roundup
So let's clear some things up for potential questions about this.
1. Isn't the gap between XBS sell through and shipments too big? Yes, but this assumes Ampere isn't underestimating sell through. Additionally, folks from Europe and elsewhere have been reporting the Series S is readily available there and has been for months. Entirely possible the Series S + some under estimating accounts for the gap. Series X is 100% sold out though. No one can buy that
Xbox One could be shipping more than I'm estimating, but where? It died at US retail in December 2020. UK sells next to nothing now. It's doubtful they were even manufacturing any this year.
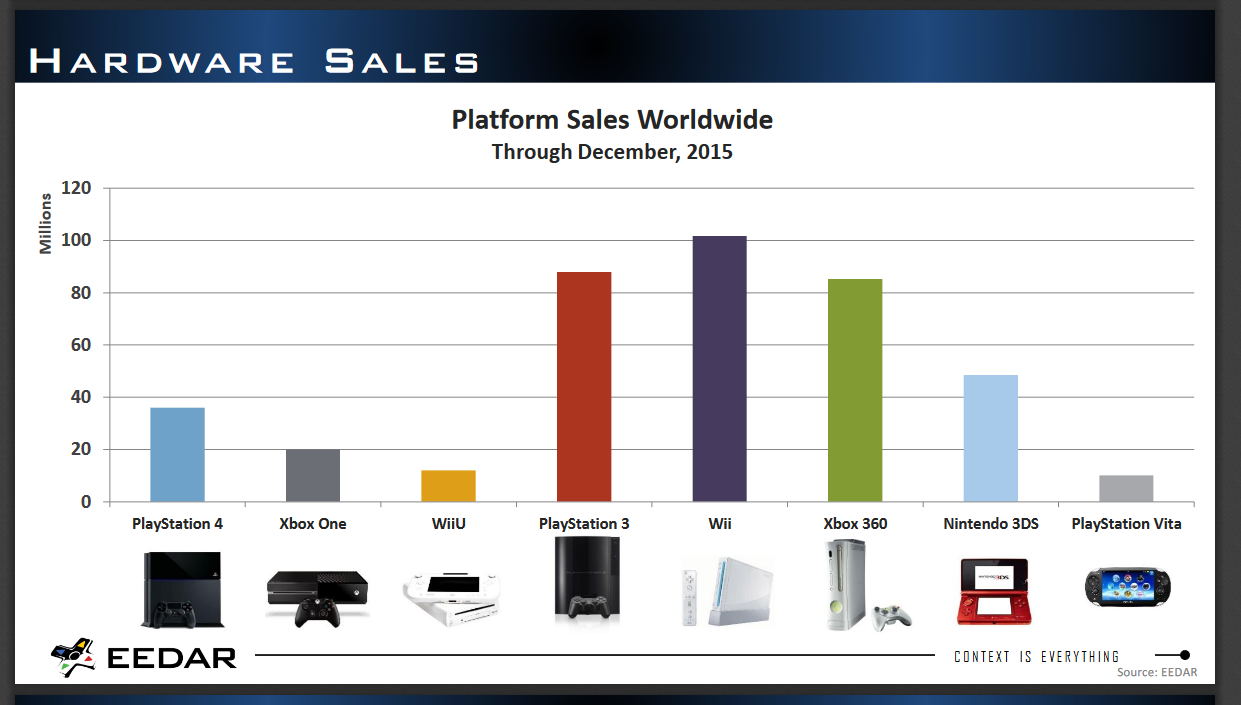
2. So the 360 shipped more than PS3? That's what I estimate. Nothing ever pointed to the PS3 surpassing the Xbox 360, and I've seen some try and pass this EEDAR report around that proves the PS3 did pass the 360, but it's wildly inaccurate.
They have the PS3 at 87.8M at the end of 2015. Sony reported the PS3 shipped 87.4M by March 2017. 3DS is also massively under tracked by literal millions.
3. Xbox One over 50M by that much? Yeah. There's only so much variance in the ASP and I think I was pretty fair on how low the ASP went. But that's what's so great about all this. Literally everything I worked with is the same stuff you can work with. Don't find my numbers accurate? I gave you every source, every revenue number. Work it out yourself and see what you come up with.
And here's an easy place to see the per quarter sales of each console that I estimated.
Updated October 24, 2023
Quarter
Xbox 360 (Quarter)
Xbox 360 (LTD)
2013 Q4 (Oct-Dec) [Official]
3,500,000
82,900,000
2014 Q1 (Jan-Mar) [Official]
800,000
83,700,000
2014 Q2 (Apr-Jun)
700,000
84,400,000
2014 Q3 (Jul-Sep)
700,000
85,100,000
2014 Q4 (Oct-Dec)
1,600,000
86,700,000
2015 Q1 (Jan-Mar)
400,000
87,100,000
2015 Q2 (Apr-Jun)
200,000
87,300,000
2015 Q3 (Jul-Sep)
100,000
87,400,000
2015 Q4 (Oct-Dec)
800,000
88,200,000
2016 Q1 (Jan-Mar)
0
88,200,000
2016 Q2 (Apr-Jun)
0
88,200,000
XB1 under construction, still needs updating as of October 24, 2023
the biggest difference i have with your estimate are the numbers from holiday 2014.
For some reasons i had a total different estimate for 360/XB1. (way higher for the 360 and worse for XB1)
the rest of my estimate are just 100k different or less so no big deal.
Overall i always put the 360 something in the 88-89 million range lifetime.
As for XB1 i just gived up shipments numbers after they stopped reporting total XBOX hardware, i just used estimate here and there.
If it's from the GAF days then I'm sure we estimated XB1 lower but that was more of a concession that the US:worldwide gap was much closer to 60:40. I didn't agree and that's why it's higher now.
So for 5 quarters we have an easy enough job of knowing exactly how many units were sold, we just need to figure out the split between Xbox 360 and XB1. We can do that through ASP estimating like we did in a previous post. To keep it easy to follow along for yourself since we are all using the same info, here's I'm setting this up.
Go into Google Sheets or Excel or whatever you use and just do something like this
The higher numbers are the Known Revenue (Top), Calculated Revenue from the lower numbers (Bottom), and the difference between the Top and Bottom (Right).
The lower numbers on the left are the Calculated Revenue from ASP and Units (Left), ASP (Center), and Units (Right). The numbers on the right are for the 5 quarters with known numbers and are meant to be a guide to make sure we are reaching the total. After the Xbox 360 is gone we will still need a total as we will try to estimate Xbox One S and X when they come along.
It would take literal hours to have to explain every single quarter in detail so only for those that absolutely need it, I'm going to try and provide basic info and math with results. Also for easiness I'm going to table these in calendar year, not fiscal year. Also note that every PR from MS Financials compares Year over Year.
And REMEMBER these are merely estimates. The revenue isn't going to be exact. Microsoft rounds to the nearest million. Units aren't uber accurate. They aren't meant to be some psychic look into Phil Spencer's spreadsheets. These are Welfare Estimates.
2014
Quarter
Xbox 360
Xbox One
Notes
Q1 (Jan-Mar)
800,000
1,200,000
Known Official Numbers
Q2 (Apr-Jun)
600,000
500,000
[1] / 1.1M Combined
Q3 (Jul-Sep)
600,000
1,800,000
[2] / 2.4M Combined / XB1 +28 markets
Q4 (Oct-Dec)
1,450,000
5,160,000
[3] / 6.6M Combined / XB1 Price Cut
Total (Life To Date)
3,550,000 (86,450,000)
8,660,000 (12,560,000)
[1] Immediately and I might have a aneurysm on this one.
Basically Amy Hood, the executive vice president and chief financial officer, said that Microsoft would be working clearing out existing inventory of Xbox hardware. Xbox One at the end of 2013 had a confirmed 900,000 units unsold (3M sell through / 3.9M shipped) and by the end of March 2014 the best estimate would put XB1 at another 900,000 units unsold (~4.2M sell through / 5.1M shipped).
Thanks to NPD leaks from June 2014 we know the $399 SKU only sold 108K units, meaning the $499 Kinect sold 281K total in Q2. That would be ~470K total worldwide following trends at the time, meaning the unsold units purely from end of March 2014 would drop to ~430K. Considering it took 3 whole months to move ~470K (~36K a week) it would take a further 11 weeks to sell out remaining Kinect units. Needing to ship anymore Kinect units seems unnecessary for Q2.
That leaves the only Xbox One thing that would be shipped is the $399 SKU, and as I said it sold through 108K in the US in June 2014. Now obviously shipments are going to be higher than that, probably have to account for another month's worth since Microsoft and retailers probably expected big things out of the price cut.
XB1 in total ($399 + $499) would sell 131K in July. Let's just say that's the extra shipments in June and put the US shipment of the $399 SKU at ~240K. US was ~60% of worldwide sales at the time so that's an easy extrapolation to 400K exactly.
Now that might seem absurd to you. Only 400K XB1 compared to 700K 360's? Why would Microsoft ship so many 360's? Well, all I can comment on is that XB1 sell through was dreadful in 2014 and the Amy Hood quote above would be most relevant to XB1. Maybe Microsoft shipped ~100K XB1 Kinect's at the beginning of April then stopped and the total is ~500K? Possible. Another possible reason this is correct is because, maybe Xbox 360 shipping more than XB1 was exactly the reason Microsoft started hiding numbers.
[2] This is easier to explain since I did it in this post here. I'll further elaborate and say the ASP I used was XB1: $425 / 360: $214 which equaled $893,400,000 ($400,000 "off" as the revenue is rounded to the millions)
[3] You are going to have to trust me on this but I remember Microsoft saying somewhere that Xbox One sold 10 Million units on December 3 yet I can't find it!
Xbox 360 ASP is going to be below $200 considering some Black Friday sales were $179 or $99 4GB depending on the retailer. Worldwide I'm not sure how drastic the cuts were so we could keep put 360 something at $180-$190 ASP this quarter.
Xbox One had a ton of SKU variety along with a US price cut to $349 in November and a further $329 Black Friday price. Now, this wouldn't mean the ASP is going to be ~$349 worldwide. Other regions would obviously have deals but if we were to estimate a US ASP, we might have to lob on a few extra dollars as insurance.
Basically even with the $329 deal for Black Friday, the COD and Kinect bundle should have kept the ASP a bit over $349. Like $360-$370, then with worldwide we'll add on an extra $10, so $370-$380
I came to the following ASP. XB1: $370 / 360: $184 which equaled $2,176,000,000 ($0 "off" as the revenue is rounded to the millions). Remember from an earlier post that FY 2015 shipments equaled 12.1M, so we have some wiggle room to do something like XB1 5.16M
2015
Quarter
Xbox 360
Xbox One
Notes
Q1 (Jan-Mar)
450,000
1,170,000
[4] / 1.6M Combined
Q2 (Apr-Jun)
200,000
1,230,000
[5] / 1.4M Combined
Q3 (Jul-Sep)
190,000
1,900,000
[6]
Q4 (Oct-Dec)
440,000
5,370,000
[7]
Total (Life To Date)
1,280,000 (87,730,000)
9,670,000 (22,130,000)
[4] Taken from here, "driven by a 20% decline in console volume and lower prices of Xbox One consoles compared to the prior year.". So total hardware units are down along with Xbox One ASP. Could mean both Xbox 360 and XB1 are down in units, or that only the 360 is down but XB1 didn't increase.
In the US, XB1 stayed at its $349 base price. This is a massive drop from the $499 of 2014. Xbox 360 should've just gone back up to what it was selling before Q4 2014, so around that $210-$220 range.
I came to the following ASP. XB1: $378 / 360: $215 which equaled $539,010,000 ($10,000 "off" as the revenue is rounded to the millions). I just reused the Q4 ASP for XB1 since the lower sales of the Kinect and COD bundles would be countered by the increase in price worldwide in a non holiday quarter. I also just made sure XB1 was slightly down in units.
[5] Taken from here, "driven by higher volumes of consoles sold, offset in part by lower prices of Xbox Ones sold.". Makes sense since the base price is now $349, even with the introduction of a new 1TB model at $399 in June. The UK also saw a £30 price cut, along with the general slow down of Kinect sales in 2015, the ASP of XB1 should be approaching closer to $349. Maybe like $360. Xbox 360 should be around the same.
I came to the following ASP. XB1: $365 / 360: $210 which equaled $490,950,000 ($50,000 "off" as the revenue is rounded to the millions).
[6] Taken from here, "Xbox hardware revenue decreased 17%, mainly due to lower volumes of Xbox 360 consoles sold." If the reason for revenue decline was Xbox 360 units, that should mean Xbox One is either flat at worst or even up YOY. ASP should be well down from 2014 Q3 so it's actually highly likely Xbox One is up in units.
A "spoiler" but for the Fiscal Year 2016 (July 2015 - June 2016) Microsoft reported Xbox One was up in units.
There were some more $399 bundles released so the ASP should increase slightly. Xbox 360 could be going down in ASP as the year goes on. Less stock but in general way lower base demand at standard prices as 8th gen gets into high gear and retailers want to clear inventory.
I came to the following ASP. XB1: $370 / 360: $200 which equaled $741,000,000 ($0 "off" as the revenue is rounded to the millions).
[7] Taken from here, "Xbox One revenue decreased slightly, due to higher console volume, offset by lower prices of consoles sold." I calculated Xbox One revenue to be $1,909,200,000 so we just have to get nit picky on what "slightly" means. Personally I take it to mean <$10M, so still above $1,900,000,000.
Now because Xbox One is determined by itself, it's pretty important to the the Xbox 360 as that will be the remainder. To keep the number from being massively inflated (like +500K) that's how I came to my Xbox One estimates for 2014.
In Q4, XB1 was available at $299 during Black Friday and Christmas shopping which would help bring ASP down from 2014. There were still plenty of new $399 bundle along with the introduction of new $499 options such as the Halo 5 Bundle, Elite, and another Kinect bundle. Every Xbox One would receive a price cut during the holidays so the ASP should be well below the ~$380 it was last year. Xbox 360 should be massively discounted going by 2014 but I can't find deals. Since the 360 is near dead in 2016 I'm assuming even bigger drops in ASP this holiday.
I came to the following ASP. XB1: $355 / 360: $168 which equaled $1,980,270,000 ($270,000 "off" as the revenue is rounded to the millions).
2016
Quarter
Xbox 360
Xbox One
Notes
Q1 (Jan-Mar)
60,000
1,080,000
[8]
Q2 (Apr-Jun)
30,000
1,020,000
[9] / Xbox 360 Discontinued
Q3 (Jul-Sep)
0
1,810,000
[10]
Q4 (Oct-Dec)
0
5,340,000
[11]
Total (Life To Date)
90,000 (87,820,000)
9,250,000 (31,380,000)
[8] Taken from here, "Xbox hardware revenue decreased 26%, mainly due to a decline in Xbox 360 console volume and lower prices of Xbox One consoles sold." Now because they mention Xbox 360 volume (units) and XB1 prices (ASP) being the main reason for the decline in revenue, XB1 units should be flat or slightly down at worst.
Xbox One ASP is confirmed down and should actually be close to $349 as March saw a quick $299 price promotion. Above Q4 ASP due to length of price cuts but still below Q1 2015.
Xbox 360 should just be considered dead at this point and retailers should be pushing the price down to get rid of inventory left over. Low ASP probably near holiday prices.
I came to the following ASP. XB1: $359 / 360: $185 which equaled $398,820,000 ($180,000 "off" as the revenue is rounded to the millions).
[9] Taken from here, the fiscal year result is "Xbox hardware revenue decreased 16%, mainly due to lower prices of Xbox One consoles sold and a decline in Xbox 360 console volume, offset in part by higher Xbox One console volume." Xbox One FY 2016 is higher than FY 2015.
Taken from here, the quarter result is "Xbox hardware revenue decreased 33%, mainly due to a decline in consoles sold and lower prices of consoles sold." So in general the decline in XB1 units this quarter should be bigger than I've been calculating before.
April 20, 2016: Xbox 360 manufacturing discontinued Source
Now Q2 is a big quarter in that Xbox just went "Fuck this" and dropped the prices super low in June. 500GB and Kinect bundles were $279 and the 1TB was $299. April had continued the March price promo so really only May sales would keep up the ASP above $300.
Xbox 360 is almost meaningless at this point. Microsoft doesn't even to bother mention it as a reason for declining revenue.
I came to the following ASP. XB1: $317 / 360: $175 which equaled $328,590,000 ($410,000 "off" as the revenue is rounded to the millions).
[10] Taken from here, "Xbox hardware revenue decreased 26%, mainly due to lower prices of consoles sold and a decline in volume of consoles sold." No question, Xbox One is down YOY. Xbox 360 shipments should be dead since manufacturing ended in April.
The Xbox One S launched at $299, $349, and a limited $399. The Xbox One also went even lower to $249 in July. We also had ASP leaks for NPD for this quarter that lead to revenue looking like this: Q3 Revenue = ~$234,760,000 and with units that leads to the following ASP of $301. Pretty easy that one huh?
I came to the following ASP. XB1: $304 which equaled $550,240,000 ($240,000 "off" as the revenue is rounded to the millions).
[11] Taken from here, "Xbox hardware revenue decreased 22%, mainly due to lower prices of consoles sold and a decline in volume of consoles sold." All this points to is Xbox One 2016 is lower than the combined Xbox 360 + Xbox One 2015. Could even be up YOY.
We had an ASP leak for October but it won't matter as much since November and December had massive $249 deals. ASP should be in the $280-$290 range as the 1TB bundles were still popular at $349 and then $299.
I came to the following ASP. XB1: $291 which equaled $1,553,940,000 ($60,000 "off" as the revenue is rounded to the millions).
2017
Quarter
Xbox One
Notes
Q1 (Jan-Mar)
1,190,000
[12]
Q2 (Apr-Jun)
730,000
[13]
Q3 (Jul-Sep)
940,000
[14]
Q4 (Oct-Dec)
5,400,000
[15]
Total (Life To Date)
8,260,000 (39,640,000)
[12] This quarter Microsoft decided to just not say anything about hardware. Seeing the revenue, it wasn't anything to note. It would be weird to not mention Xbox hardware units are up YOY as even with an ASP of $350 (impossible) Xbox would still be up YOY.
There was another $50 cut. Not really much else to say other than ASP should be in a range of $300-$320 depending how high sales spiked during the promotions.
I came to the following ASP. XB1: $317 which equaled $377,230,000 ($230,000 "off" as the revenue is rounded to the millions).
[13] Taken from here, the fiscal year result is "Xbox hardware revenue decreased 21%, mainly due to lower prices of consoles sold and a decline in volume of consoles sold." Xbox FY 2017 is lower than FY 2016.
Taken from here, the quarter result is "Xbox hardware revenue decreased 29%, driven by lower prices and a decline in volume of consoles sold." No idea why they mention hardware now. This is the worst quarter!
There was certainly a price promotion in June but because of the announcement of the Xbox One X the One S just stagnates. The ASP shouldn't be that different from the last quarter.
I came to the following ASP. XB1: $319 which equaled $232,870,000 ($130,000 "off" as the revenue is rounded to the millions).
[14] Taken from here, "Xbox hardware revenue decreased 48%, mainly due to a decline in volume of consoles sold and lower prices of consoles sold." It was around here that the 500GB went down to $279. Will lower the ASP a bit but it shouldn't be much. Other than that nothing happened.
I came to the following ASP. XB1: $303 which equaled $284,820,000 ($180,000 "off" as the revenue is rounded to the millions).
[15] Taken from here, "Xbox hardware revenue increased 14%, primarily due to the launch of Xbox One X." Xbox One X was $499 which would represent a massive ASP spike.
There was a leak for Xbox One X NPD November that put it over 430K. This holiday is also when Xbox One S would go below $200. At this point the ASP guessing is going to be hard as now the One X is going to have a big impact. In general, over the years, it's been assumed the One X averaged ~30% of sales after launch.
I came to the following ASP. XB1: $329 which equaled $1,775,000,000 ($0 "off" as the revenue is rounded to the millions). I estimate 1.7M X's were shipped.
2018
Quarter
Xbox One
Notes
Q1 (Jan-Mar)
1,040,000
[16]
Q2 (Apr-Jun)
1,110,000
[17]
Q3 (Jul-Sep)
1,640,000
[18]
Q4 (Oct-Dec)
5,090,000
[19]
Total (Life To Date)
8,880,000 (48,520,000)
[16] Literally nothing on hardware. Ugh
There were some $229/$249 deals on the S. Around here is where I feel the 500GB falls in favor of the 1TB as the PUBG and Sea of Thieves bundle were that. The X saw some love where for two weeks you could PUBG or Sea of Thieves free.
I came to the following ASP. XB1: $341 which equaled $354,980,000 ($20,000 "off" as the revenue is rounded to the millions).
[17] Literally nothing on hardware, again. At this point PUBG and Fortnite were so strong for Xbox they were driving growth alone.
This quarter saw the first Xbox One X promo to $449 and steeper One S cuts to $199 for the 500GB. ASP will be lower than Q1 and in turn higher units since revenue actually increased quarter over quarter.
I came to the following ASP. XB1: $327 which equaled $363,270,000 ($270,000 "off" as the revenue is rounded to the millions).
[18] Taken from here, "Xbox hardware revenue growth of 94%, against a low prior year comparable due to timing of the Xbox One X launch in the second quarter of fiscal year 2018." Nothing from this other than everything is up.
No price cuts this quarter so everything should be near MSRP.
I came to the following ASP. XB1: $338 which equaled $553,760,000 ($240,000 "off" as the revenue is rounded to the millions).
[19] Taken from here, "...offset in part by a decline in Xbox hardware of 19% due to the launch of Xbox One X in the second quarter of fiscal year 2018."
There were massive sales again this holiday going back to $199 and the One X was on sale for $399 for the entirety of Black Friday week through December.
I came to the following ASP. XB1: $281 which equaled $1,430,150,000 ($150,000 "off" as the revenue is rounded to the millions).
2019
Quarter
Xbox One
Notes
Q1 (Jan-Mar)
710,000
[20]
Q2 (Apr-Jun)
580,000
[21]
Q3 (Jul-Sep)
1,120,000
[22]
Q4 (Oct-Dec)
3,490,000
[23]
Total (Life To Date)
5,900,000 (54,420,000)
[20] Taken from here, "...offset in part by a decline in Xbox hardware of 33% primarily due to a decrease in volume of consoles sold." Nothing on lower prices so the ASP should be similar to last year or the units drop is massive the lower prices didn't matter as much.
The One X went to $399 in February with the Fallout 76 bundle. Only that bundle as others were still $499. The One S went to $249 a couple of times but never went as low as it did in 2018.
I came to the following ASP. XB1: $337 which equaled $239,080,000 ($80,000 "off" as the revenue is rounded to the millions).
[21] Taken from here, the fiscal year result is "...offset in part by a decline in Xbox hardware of 13% primarily due to a decrease in volume of consoles sold." So units are down from last fiscal year.
Taken from here, the quarter result is "Xbox hardware revenue declined 48%, primarily due to a decrease in volume of consoles sold." Units down from last year.
This quarter saw the release of the Xbox One S All Digital Edition at $249, but it was a limited release in the US that wouldn't expand until the holidays and no mention was made of it here so it shouldn't have had much impact. There were some price cuts but sales at this point weren't getting boosted by them.
I came to the following ASP. XB1: $325 which equaled $188,750,000 ($250,000 "off" as the revenue is rounded to the millions).
[22] Taken from here, "...driven by a decrease in Xbox hardware of 34%, primarily due to a decrease in volume of consoles sold." Units down again.
There was one week of a price cut but it was nothing, really. I think the Fallout bundle deal ended here so that should be $499 again. Everything should be close to MSRP.
I came to the following ASP. XB1: $327 which equaled $366,320,000 ($320,000 "off" as the revenue is rounded to the millions).
[23] Taken from here, "Xbox hardware revenue decreased 43%, primarily due to a decrease in volume and price of consoles sold." So ASP and units are down big time.
The SAD hit $149, One S $199, and One X $349. The SAD was also really popular this holiday.
I came to the following ASP. XB1: $235 which equaled $819,790,000 ($210,000 "off" as the revenue is rounded to the millions).
2020
Quarter
Xbox One
Xbox Series
Note
Q1 (Jan-Mar)
680,000
0
[24]
Q2 (Apr-Jun)
1,050,000
0
[25]
Q3 (Jul-Sep)
890,000
0
[26]
Q4 (Oct-Dec)
300,000
3,190,000
[27]
Total (Life To Date)
2,920,000 (57,340,000)
3,190,000
[24] Taken from here, "Xbox hardware revenue decreased 20%, primarily due to a decrease in price of consoles sold." So ASP went down while units not so much.
Now, this March is the start of the Covid 19 pandemic. Mid March is when the shit really hits and consoles start selling out. MS found it smart to also give the One X a permanent price drop to $399 after having a $299 promo in February.
I came to the following ASP. XB1: $283 which equaled $192,480,000 ($480,000 "off" as the revenue is rounded to the millions).
[25] Taken from here, the fiscal year result is "Xbox hardware revenue declined 31%, primarily due to a decrease in volume and price of consoles sold."
Taken from here, the quarter result is "Xbox hardware revenue increased 49%, primarily due to an increase in volume of consoles sold." Xbox is up from last year. This is thanks entirely to the pandemic.
The Xbox One X was pretty much sold at $299 this entire quarter and on June 5 the SAD went to $199 while supplies lasted. This would also be the last quarter the One X and SAD were shipped as only the One S was the remaining unit selling after June.
I came to the following ASP. XB1: $269 which equaled $282,000,000 ($0 "off" as the revenue is rounded to the millions).
[26] Taken from here, "Xbox hardware revenue declined 27%, driven by a decrease in volume of consoles sold ahead of new console launches."
The only thing shipped this quarter was the $299 Xbox One S. This is pretty easy to calculate.
I came to the following ASP. XB1: $300 which equaled $267,000,000 ($0 "off" as the revenue is rounded to the millions).
[27] Taken from here, "Xbox hardware revenue increased 86%, driven by higher price of consoles sold due to the Xbox Series X|S launches." Basically the ASP being higher is the reason for an increase.
Now here's a complicated quarter. What did Xbox Series ship? We have an idea. Leaks put XBS at 1.5M sold through in the US. Because of the pandemic, everything was (and is still) sold out. We also know XBS sales for all of January were only slightly over 100K. We can reasonably put US shipments in 2020 as 1.55M - 1.6M.
Ampere Analytics put XBS at 2.8M sold through in 2020 here, and following known lead times on shipments can be a few weeks off (PS4/5 had a 300,000 difference in sell through and shipments despite being sold out), we can assume total shipments of XBS exceed 3M and maybe slightly more.
Xbox Series has two SKU, the $499 X and $299 S. The split between both is assumed to be in the 70-80:30-20 range at this point, favoring the X.
I'm assuming a ~75:25 split for XBS this quarter leading to 2,400,000 X and 790,000 S which equaled $1,437,000,000 and the remaining revenue is Xbox One S.
2021
Quarter
Xbox One
Xbox Series
Notes
Q1 (Jan-Mar)
30,000
1,460,000
[28]
Q2 (Apr-Jun)
30,000
1,800,000
[29]
Q3 (Jul-Sep)
Q4 (Oct-Dec)
Total (Life To Date)
60,000 (57,400,000)
3,260,000 (6,450,000)
[28] Taken from here, "Xbox hardware revenue increased 232%, driven by higher price and volume of consoles sold due to the Xbox Series X|S launches."
This is the highest quarter revenue for hardware on record (going back to FY 2015).
From Ampere Analysis (here), XBS is estimated to have done ~1.2M sell through worldwide, LTD of ~4M. US sales are estimated somewhere in the ~500K-600K range from limited info. It's still sold out in this quarter so shipments wouldn't be much higher. This quarter is when the S started to become more available so I'll bump its share of the pie.
Xbox One has been dead at retail since December 2020. Nowhere is it being sold in any meaningful amount and really even 10K might be too much.
I'm assuming a ~65:35 split for XBS this quarter leading to 950,000 X and 510,000 S which equaled $628,000,000 and the remaining revenue is Xbox One S.
[29] Taken from here, the fiscal year result is "Xbox hardware revenue increased 92% driven by higher price of consoles sold due to the Xbox Series X|S launches."
Taken from here, the quarter result is "Xbox hardware revenue increased 172% driven by higher price and volume of consoles sold due to the Xbox Series X|S launches."
Microsoft also announced Xbox Series is the fastest selling Xbox ever (here). Here's the other Xbox consoles after 3 quarters:
Xbox: 3,900,000
Xbox 360: 5,000,000
Xbox One: ~5,500,000
From Ampere Analysis (here), XBS is estimated to have done ~1.35M sell through worldwide, LTD of ~5.3M. US sales are estimated somewhere in the ~600K-700K range from limited info.
Series S again became more available than the X and is starting to become a trend that the X is taking up less and less of the total share.
I'm assuming a ~60:40 split for XBS this quarter leading to 1,090,000 X and 710,000 S which equaled $758,000,000 and the remaining revenue is Xbox One S.
Roundup
So let's clear some things up for potential questions about this.
1. Isn't the gap between XBS sell through and shipments too big? Yes, but this assumes Ampere isn't underestimating sell through. Additionally, folks from Europe and elsewhere have been reporting the Series S is readily available there and has been for months. Entirely possible the Series S + some under estimating accounts for the gap. Series X is 100% sold out though. No one can buy that
Xbox One could be shipping more than I'm estimating, but where? It died at US retail in December 2020. UK sells next to nothing now. It's doubtful they were even manufacturing any this year.
2. So the 360 shipped more than PS3? That's what I estimate. Nothing ever pointed to the PS3 surpassing the Xbox 360, and I've seen some try and pass this EEDAR report around that proves the PS3 did pass the 360, but it's wildly inaccurate.
They have the PS3 at 87.8M at the end of 2015. Sony reported the PS3 shipped 87.4M by March 2017. 3DS is also massively under tracked by literal millions.
3. Xbox One over 50M by that much? Yeah. There's only so much variance in the ASP and I think I was pretty fair on how low the ASP went. But that's what's so great about all this. Literally everything I worked with is the same stuff you can work with. Don't find my numbers accurate? I gave you every source, every revenue number. Work it out yourself and see what you come up with.
And here's an easy place to see the per quarter sales of each console that I estimated.
Great work. Your Xbox One numbers make sense because someone actually asked Daniel Ahmad on Twitter - I don't remember if in 2019 or 2020 - if Xbox One was over 50 million and he said it had been "for a while" or something to that effect. It's definitely closer to 60 than to 50.
Great work. Your Xbox One numbers make sense because someone actually asked Daniel Ahmad on Twitter - I don't remember if in 2019 or 2020 - if Xbox One was over 50 million and he said it had been "for a while" or something to that effect. It's definitely closer to 60 than to 50.
That was during March 2020 when Zhuge said that X1 was over 50 mil. as a reaction to AMDs statement how they shipped chips in over 150 mil. consoles. BUT there was a problem. AMD used VGChartz numbers :
While cruising through the slides from AMD's recent financial analyst day I noticed something interesting: They sourced VG Chartz for their console sales data. I've seen a few websites through up headlines like "AMD: Consoles have sold 150 million units since 2013". Others have used simple...
www.resetera.com
Also, both PS4 and X1 sales declined heavily in 2020, more so X1 ( discountinued just 4 months after AMDs statement ). So, i doubt that X1 passed even 55 mil. Just as a reminder, PS4 passed 110 mil. sold units as of March 2020.
Where else would they include other hardware revenue? I tried doing something similar with Sony's FY where hardware is just console sales and the numbers were notably below MSRP prices of PS4.
Things get even more anbiguous with next gen as there are two separately priced SKUs, so now you would need a weighted average, the assumptions being the weights which afaik we haven't got a global number for either Xbox or Playstation.
Below is my annual letter, published today in our Annual Report 2022. Dear shareholders, colleagues, customers, and partners: We are living through a period of historic economic, societal, and geopolitical change.
PS5 had a 63% market share in Microsoft's FY2021 Q1-3 PS5 Calendar Year 2020 Quarter 4: 4,500,000 PS5 Calendar Year 2021 Quarter 1: 3,300,000 Total: 7,800,000 7,800,000 / 0.63 = 12,380,000 Xbox Series = ~4,600,000 PS5 had a 54% market share in Microsoft's FY2022 Q1-3 PS5 Calendar Year 2021...
www.installbaseforum.com
In summary, Xbox Series October 2020 to March 2021 shipments were 4.6M, and Xbox July 2021 to March 2022 shipments were 7.8M
Monday, December 3, 2014Meydenbauer Center, Bellevue WA
web.archive.org
Finally, our gaming business is thriving with the Xbox One hitting 10 million units sold. I am thrilled to welcome Mojang and Minecraft community to Microsoft.
This site uses cookies to help personalise content, tailor your experience and to keep you logged in if you register.
By continuing to use this site, you are consenting to our use of cookies.