
- Pronouns
- He/Him
- Thread starter
- #1
Sorry for the wait.
https://www.capcom.co.jp/ir/english/news/html/e230510b.html
Sources
Financial Results - https://www.capcom.co.jp/ir/english/data/pdf/result/2022/full/result_2022_full_01.pdf
Financial Results Presentation - https://www.capcom.co.jp/ir/english/data/pdf/explanation/2022/full/explanation_2022_full_02.pdf
Business Divisional Strategies and Projections - https://www.capcom.co.jp/ir/english/data/pdf/explanation/2022/full/explanation_2022_full_01.pdf
Previous threads
FY3/2023
Q1 - https://www.installbaseforum.com/forums/threads/capcom-q1-fy3-2023-financial-results.947/
Q2 - https://www.installbaseforum.com/forums/threads/capcom-q2-fy3-2023-financial-results.1139/
Q3 - https://www.installbaseforum.com/forums/threads/capcom-q3-fy3-2023-financial-results.1340/
https://www.capcom.co.jp/ir/english/news/html/e230510b.html
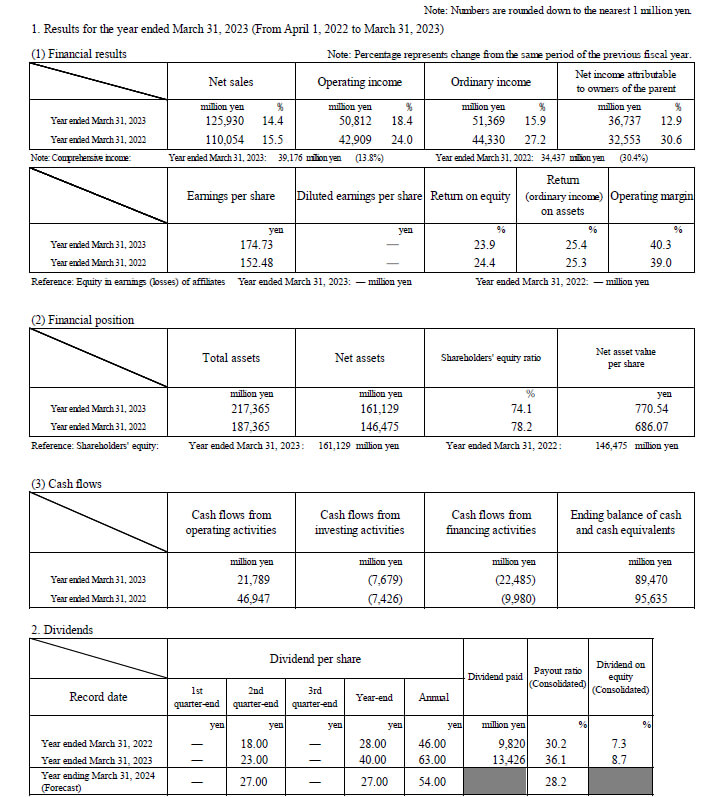
Capcom Co., Ltd. today announced that in its consolidated business results for the fiscal year ended March 31, 2023, net sales were 125,930 million yen (up 14.4 % from the previous fiscal year), operating income was 50,812 million yen (up 18.4 % from the previous fiscal year), ordinary income was 51,369 million yen (up 15.9 % from the previous fiscal year), and net income attributable to owners of the parent was 36,737 million yen (up 12.9 % from the previous fiscal year).
During the fiscal year ended March 31, 2023, Capcom’s core Digital Contents business delivered annual sales of 41.7 million units for its home video game software, marking a year-over-year increase. The company achieved this with the release of major new titles in its flagship series, including Resident Evil 4 and Monster Hunter Rise: Sunbreak, as well as through pursuing catalog title sales digitally. Further, the company expanded earnings by leveraging these major brands in movies, character merchandise, and eSports, while promoting efficient operations at stores and new store formats in its Arcade Operations business, and utilizing its IP in its Amusement Equipments businesses. As a result, Capcom achieved record-high net sales, the sixth consecutive year of record-high profit at all levels, and its tenth consecutive year of operating income growth.
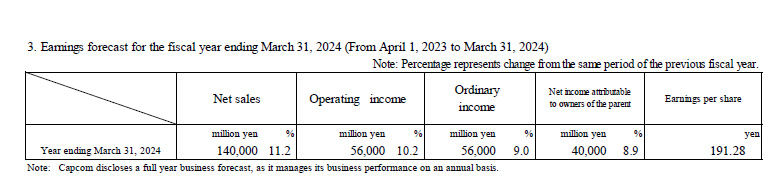
Moving forward, for the fiscal year ending March 31, 2024, Capcom anticipates net sales of 140,000 million yen and operating income of 56,000 million yen, which would result in eleven consecutive years of operating income growth and seven consecutive years of record high profit at all levels.
Sources
Financial Results - https://www.capcom.co.jp/ir/english/data/pdf/result/2022/full/result_2022_full_01.pdf
Financial Results Presentation - https://www.capcom.co.jp/ir/english/data/pdf/explanation/2022/full/explanation_2022_full_02.pdf
Business Divisional Strategies and Projections - https://www.capcom.co.jp/ir/english/data/pdf/explanation/2022/full/explanation_2022_full_01.pdf
Previous threads
FY3/2023
Q1 - https://www.installbaseforum.com/forums/threads/capcom-q1-fy3-2023-financial-results.947/
Q2 - https://www.installbaseforum.com/forums/threads/capcom-q2-fy3-2023-financial-results.1139/
Q3 - https://www.installbaseforum.com/forums/threads/capcom-q3-fy3-2023-financial-results.1340/
The following tables come from my webpage: https://r134x7.github.io/nintendo-earnings-data-and-other-video-game-companies/#/capcom
Consolidated Operating Results:
Sales Per Software Unit:
Since it is the end of FY3/2023, that means Special Page Data:
Consolidated Operating Results (Cumulative):
Sales Per Software Unit (Cumulative):
Consolidated Operating Results:
Code:
+−−−−−−−−−−−−−−−−−−−−−−−−−−−−−−−−−−−−+
| CAPCOM Co., Ltd. | FY3/2023        |
+−−−−−−−−−−−−−−−−−−−−−−−−−−−−−−−−−−−−+
| Consolidated Financial Results     |
+−−−−−−−−−−−−−−−−−−−−−−−−−−−−−−−−−−−−+
+−−−−−−−−−−−−−−−−−−−−−−−−−−−−−+
| Data as of March 31st, 2023 |
+−−−−−−−−−−−−−−−−−−−−−−−−−−−−−+

+−−−−−−−−−−−−−−−−−−−−−−−−−−−−−−−−−−−−−−−−+
| Net Sales                  |      YoY% |
+−−−−−−−−−−−−−−−−−−−−−−−−−−−−−−−−−−−−−−−−+
| 1st Quarter |     ¥25,232M |   -47.89% |
+−−−−−−−−−−−−−−−−−−−−−−−−−−−−−−−−−−−−−−−−+
| 2nd Quarter |     ¥23,835M |   +10.49% |
+−−−−−−−−−−−−−−−−−−−−−−−−−−−−−−−−−−−−−−−−+
| 3rd Quarter |     ¥30,604M |   +68.45% |
+−−−−−−−−−−−−−−−−−−−−−−−−−−−−−−−−−−−−−−−−+
| 4th Quarter |     ¥46,259M |  +111.32% |
+========================================+
| 1st Half    |     ¥49,067M |    -29.9% |
+−−−−−−−−−−−−−−−−−−−−−−−−−−−−−−−−−−−−−−−−+
| 1st 3/4     |     ¥79,671M |    -9.63% |
+−−−−−−−−−−−−−−−−−−−−−−−−−−−−−−−−−−−−−−−−+
|FY3/2023 Cml.|    ¥125,930M |   +14.43% |
+−−−−−−−−−−−−−−−−−−−−−−−−−−−−−−−−−−−−−−−−+
+−−−−−−−−−−−−−−−−−−−−−−−−−−−−−−−−+
|FY3/2023 Forecast|    ¥120,000M |
+−−−−−−−−−−−−−−−−−−−−−−−−−−−−−−−−+
| FCST Revision 1 |    ¥125,000M |
+−−−−−−−−−−−−−−−−−−−−−−−−−−−−−−−−+
|FY3/2024 Forecast|    ¥140,000M |
+−−−−−−−−−−−−−−−−−−−−−−−−−−−−−−−−+
###
+−−−−−−−−−−−−−−−−−−−−−−−−−−−−−−−−−−−−−−−−+
| Operating Income           |      YoY% |
+−−−−−−−−−−−−−−−−−−−−−−−−−−−−−−−−−−−−−−−−+
| 1st Quarter |     ¥12,061M |    -48.9% |
+−−−−−−−−−−−−−−−−−−−−−−−−−−−−−−−−−−−−−−−−+
| 2nd Quarter |      ¥9,834M |   +84.85% |
+−−−−−−−−−−−−−−−−−−−−−−−−−−−−−−−−−−−−−−−−+
| 3rd Quarter |     ¥11,437M |    +85.3% |
+−−−−−−−−−−−−−−−−−−−−−−−−−−−−−−−−−−−−−−−−+
| 4th Quarter |     ¥17,480M |  +123.73% |
+========================================+
| 1st Half    |     ¥21,895M |    -24.3% |
+−−−−−−−−−−−−−−−−−−−−−−−−−−−−−−−−−−−−−−−−+
| 1st 3/4     |     ¥33,332M |    -5.03% |
+−−−−−−−−−−−−−−−−−−−−−−−−−−−−−−−−−−−−−−−−+
|FY3/2023 Cml.|     ¥50,812M |   +18.42% |
+−−−−−−−−−−−−−−−−−−−−−−−−−−−−−−−−−−−−−−−−+
+−−−−−−−−−−−−−−−−−−−−−−−−−−−−−−−−+
|FY3/2023 Forecast|     ¥48,000M |
+−−−−−−−−−−−−−−−−−−−−−−−−−−−−−−−−+
| FCST Revision 1 |     ¥50,000M |
+−−−−−−−−−−−−−−−−−−−−−−−−−−−−−−−−+
|FY3/2024 Forecast|     ¥56,000M |
+−−−−−−−−−−−−−−−−−−−−−−−−−−−−−−−−+
###
+−−−−−−−−−−−−−−−−−−−−−−−−−−−−+
| Operating Margin           |
+−−−−−−−−−−−−−−−−−−−−−−−−−−−−+
| 1st Quarter |        47.8% |
+−−−−−−−−−−−−−−−−−−−−−−−−−−−−+
| 2nd Quarter |       41.26% |
+−−−−−−−−−−−−−−−−−−−−−−−−−−−−+
| 3rd Quarter |       37.37% |
+−−−−−−−−−−−−−−−−−−−−−−−−−−−−+
| 4th Quarter |       37.79% |
+============================+
| 1st Half    |       44.62% |
+−−−−−−−−−−−−−−−−−−−−−−−−−−−−+
| 1st 3/4     |       41.84% |
+−−−−−−−−−−−−−−−−−−−−−−−−−−−−+
|FY3/2023 Cml.|       40.35% |
+−−−−−−−−−−−−−−−−−−−−−−−−−−−−+
+−−−−−−−−−−−−−−−−−−−−−−−−−−−−−−−−+
|FY3/2023 Forecast|          40% |
+−−−−−−−−−−−−−−−−−−−−−−−−−−−−−−−−+
| FCST Revision 1 |          40% |
+−−−−−−−−−−−−−−−−−−−−−−−−−−−−−−−−+
|FY3/2024 Forecast|          40% |
+−−−−−−−−−−−−−−−−−−−−−−−−−−−−−−−−+
###
+−−−−−−−−−−−−−−−−−−−−−−−−−−−−−−−−−−−−−−−−+
| Net Income                 |      YoY% |
+−−−−−−−−−−−−−−−−−−−−−−−−−−−−−−−−−−−−−−−−+
| 1st Quarter |      ¥9,007M |   -48.06% |
+−−−−−−−−−−−−−−−−−−−−−−−−−−−−−−−−−−−−−−−−+
| 2nd Quarter |      ¥7,135M |   +46.24% |
+−−−−−−−−−−−−−−−−−−−−−−−−−−−−−−−−−−−−−−−−+
| 3rd Quarter |      ¥7,468M |   +66.36% |
+−−−−−−−−−−−−−−−−−−−−−−−−−−−−−−−−−−−−−−−−+
| 4th Quarter |     ¥13,127M |  +124.59% |
+========================================+
| 1st Half    |     ¥16,142M |   -27.35% |
+−−−−−−−−−−−−−−−−−−−−−−−−−−−−−−−−−−−−−−−−+
| 1st 3/4     |     ¥23,610M |    -11.6% |
+−−−−−−−−−−−−−−−−−−−−−−−−−−−−−−−−−−−−−−−−+
|FY3/2023 Cml.|     ¥36,737M |   +12.85% |
+−−−−−−−−−−−−−−−−−−−−−−−−−−−−−−−−−−−−−−−−+
+−−−−−−−−−−−−−−−−−−−−−−−−−−−−−−−−+
|FY3/2023 Forecast|     ¥34,500M |
+−−−−−−−−−−−−−−−−−−−−−−−−−−−−−−−−+
| FCST Revision 1 |     ¥36,500M |
+−−−−−−−−−−−−−−−−−−−−−−−−−−−−−−−−+
|FY3/2024 Forecast|     ¥40,000M |
+−−−−−−−−−−−−−−−−−−−−−−−−−−−−−−−−+
###
Sales Per Software Unit:
Code:
+−−−−−−−−−−−−−−−−−−−−−−−−−−−+
| Capcom         | FY3/2023 |
+−−−−−−−−−−−−−−−−−−−−−−−−−−−+
| Segment Information |
+−−−−−−−−−−−−−−−−−−−−−+
+−−−−−−−−−−−−−−−−−−−−−−−−−−−−−+
| Data as of March 31st, 2023 |
+−−−−−−−−−−−−−−−−−−−−−−−−−−−−−+
+−−−−−−−−−−−−−−−−−−−−−−−−−−−−−−−−−−−−−−−−+
| Digital Contents - Package & Digital   |
+−−−−−−−−−−−−−−−−−−−−−−−−−−−−−−−−−−−−−−−−−−−−−−−−−−+
|             |             |          | Sales Per |
|             |             | Software |  Software |
|             |       Sales |    Units |      Unit |
+−−−−−−−−−−−−−−−−−−−−−−−−−−−−−−−−−−−−−−−−−−−−−−−−−−+
| 1st Quarter |    ¥19,200M |    11.7M |    ¥1,641 |
|        YoY% |     -55.35% |  -12.03% |   -49.24% |
+−−−−−−−−−−−−−−−−−−−−−−−−−−−−−−−−−−−−−−−−−−−−−−−−−−+
| 2nd Quarter |    ¥15,700M |     9.6M |    ¥1,635 |
|        YoY% |      +6.08% |  +47.69% |   -28.19% |
+−−−−−−−−−−−−−−−−−−−−−−−−−−−−−−−−−−−−−−−−−−−−−−−−−−+
| 3rd Quarter |    ¥24,300M |     7.8M |    ¥3,115 |
|        YoY% |    +153.12% |     +30% |   +94.69% |
+−−−−−−−−−−−−−−−−−−−−−−−−−−−−−−−−−−−−−−−−−−−−−−−−−−+
| 4th Quarter |    ¥36,100M |    12.6M |    ¥2,865 |
|        YoY% |    +127.04% |  +85.29% |   +22.54% |
+==================================================+
| First Half  |    ¥34,900M |    21.3M |    ¥1,638 |
|        YoY% |     -39.62% |   +7.58% |   -43.88% |
+−−−−−−−−−−−−−−−−−−−−−−−−−−−−−−−−−−−−−−−−−−−−−−−−−−+
| 1st 3 Qtrs  |    ¥59,200M |    29.1M |    ¥2,034 |
|        YoY% |     -12.17% |  +12.79% |   -22.13% |
+−−−−−−−−−−−−−−−−−−−−−−−−−−−−−−−−−−−−−−−−−−−−−−−−−−+
|FY3/2023 Cml.|    ¥95,300M |    41.7M |    ¥2,285 |
|        YoY% |     +14.41% |  +27.91% |   -10.57% |
+==================================================+
| *Sales includes: - Downloadable content          |
| purchases                                        |
+−−−−−−−−−−−−−−−−−−−−−−−−−−−−−−−−−−−−−−−−−−−−−−−−−−+

+−−−−−−−−−−−−−−−−−−−−−−−−−−−−−−−−−−−−−−−−+
| Digital Contents - Package & Digital   |
| Forecast                               |
+−−−−−−−−−−−−−−−−−−−−−−−−−−−−−−−−−−−−−−−−−−−−−−−−−−−−−−+
|                 |             |          | Sales Per |
|                 |             | Software |  Software |
|                 |       Sales |    Units |      Unit |
+−−−−−−−−−−−−−−−−−−−−−−−−−−−−−−−−−−−−−−−−−−−−−−−−−−−−−−+
|FY3/2023 Forecast|    ¥91,400M |      37M |    ¥2,470 |
+−−−−−−−−−−−−−−−−−−−−−−−−−−−−−−−−−−−−−−−−−−−−−−−−−−−−−−+
| FCST Revision 1 |    ¥95,100M |      40M |    ¥2,378 |
+−−−−−−−−−−−−−−−−−−−−−−−−−−−−−−−−−−−−−−−−−−−−−−−−−−−−−−+
|FY3/2024 Forecast|   ¥103,400M |      45M |    ¥2,298 |
+======================================================+
| *Sales includes: - Downloadable content          |
| purchases                                        |
+−−−−−−−−−−−−−−−−−−−−−−−−−−−−−−−−−−−−−−−−−−−−−−−−−−+

+−−−−−−−−−−−−−−−−−−−−−−−−−−−−−−−−+
| Package                        |
+−−−−−−−−−−−−−−−−−−−−−−−−−−−−−−−−−−−−−−−−−−−−−−−−−−+
|             |             |          | Sales Per |
|             |             | Software |  Software |
|             |       Sales |    Units |      Unit |
+−−−−−−−−−−−−−−−−−−−−−−−−−−−−−−−−−−−−−−−−−−−−−−−−−−+
| 1st Quarter |     ¥2,900M |     1.3M |    ¥2,231 |
|        YoY% |     -84.24% |  -69.05% |   -49.08% |
+−−−−−−−−−−−−−−−−−−−−−−−−−−−−−−−−−−−−−−−−−−−−−−−−−−+
| 2nd Quarter |     ¥1,400M |     0.5M |    ¥2,800 |
|        YoY% |     -71.43% |  -70.59% |    -2.85% |
+−−−−−−−−−−−−−−−−−−−−−−−−−−−−−−−−−−−−−−−−−−−−−−−−−−+
| 3rd Quarter |     ¥5,900M |    0.75M |    ¥7,867 |
|        YoY% |    +156.52% |   -37.5% |  +310.38% |
+−−−−−−−−−−−−−−−−−−−−−−−−−−−−−−−−−−−−−−−−−−−−−−−−−−+
| 4th Quarter |     ¥7,800M |    1.85M |    ¥4,216 |
|        YoY% |     +77.27% | +105.56% |   -13.77% |
+==================================================+
| First Half  |     ¥4,300M |     1.8M |    ¥2,389 |
|        YoY% |     -81.55% |  -69.49% |    -39.5% |
+−−−−−−−−−−−−−−−−−−−−−−−−−−−−−−−−−−−−−−−−−−−−−−−−−−+
| 1st 3 Qtrs  |    ¥10,200M |    2.55M |    ¥4,000 |
|        YoY% |     -60.16% |  -64.08% |   +10.93% |
+−−−−−−−−−−−−−−−−−−−−−−−−−−−−−−−−−−−−−−−−−−−−−−−−−−+
|FY3/2023 Cml.|    ¥18,000M |     4.4M |    ¥4,091 |
|        YoY% |        -40% |     -45% |    +9.09% |
+==================================================+

+−−−−−−−−−−−−−−−−−−−−−−−−−−−−−−−−−−−−−−−−+
| Package Forecast                       |
+−−−−−−−−−−−−−−−−−−−−−−−−−−−−−−−−−−−−−−−−−−−−−−−−−−−−−−+
|                 |             |          | Sales Per |
|                 |             | Software |  Software |
|                 |       Sales |    Units |      Unit |
+−−−−−−−−−−−−−−−−−−−−−−−−−−−−−−−−−−−−−−−−−−−−−−−−−−−−−−+
|FY3/2023 Forecast|    ¥18,000M |     4.5M |    ¥4,000 |
+−−−−−−−−−−−−−−−−−−−−−−−−−−−−−−−−−−−−−−−−−−−−−−−−−−−−−−+
| FCST Revision 1 |    ¥16,300M |       4M |    ¥4,075 |
+−−−−−−−−−−−−−−−−−−−−−−−−−−−−−−−−−−−−−−−−−−−−−−−−−−−−−−+
|FY3/2024 Forecast|    ¥12,500M |     2.5M |    ¥5,000 |
+======================================================+

+−−−−−−−−−−−−−−−−−−−−−−−−−−−−−−−−+
| Digital                        |
+−−−−−−−−−−−−−−−−−−−−−−−−−−−−−−−−−−−−−−−−−−−−−−−−−−+
|             |             |          | Sales Per |
|             |             | Software |  Software |
|             |       Sales |    Units |      Unit |
+−−−−−−−−−−−−−−−−−−−−−−−−−−−−−−−−−−−−−−−−−−−−−−−−−−+
| 1st Quarter |    ¥16,300M |    10.4M |    ¥1,567 |
|        YoY% |     -33.74% |  +14.29% |   -42.03% |
+−−−−−−−−−−−−−−−−−−−−−−−−−−−−−−−−−−−−−−−−−−−−−−−−−−+
| 2nd Quarter |    ¥14,300M |     9.1M |    ¥1,571 |
|        YoY% |     +44.44% |  +89.58% |   -23.81% |
+−−−−−−−−−−−−−−−−−−−−−−−−−−−−−−−−−−−−−−−−−−−−−−−−−−+
| 3rd Quarter |    ¥18,400M |    7.05M |    ¥2,610 |
|        YoY% |    +152.05% |  +46.88% |    +71.6% |
+−−−−−−−−−−−−−−−−−−−−−−−−−−−−−−−−−−−−−−−−−−−−−−−−−−+
| 4th Quarter |    ¥28,300M |   10.75M |    ¥2,633 |
|        YoY% |    +146.09% |   +82.2% |   +35.09% |
+==================================================+
| First Half  |    ¥30,600M |    19.5M |    ¥1,569 |
|        YoY% |      -11.3% |  +40.29% |   -36.78% |
+−−−−−−−−−−−−−−−−−−−−−−−−−−−−−−−−−−−−−−−−−−−−−−−−−−+
| 1st 3 Qtrs  |    ¥49,000M |   26.55M |    ¥1,846 |
|        YoY% |     +17.22% |  +41.98% |    -17.4% |
+−−−−−−−−−−−−−−−−−−−−−−−−−−−−−−−−−−−−−−−−−−−−−−−−−−+
|FY3/2023 Cml.|    ¥77,300M |    37.3M |    ¥2,072 |
|        YoY% |     +45.03% |  +51.63% |    -4.38% |
+==================================================+
| *Sales includes: - Downloadable content          |
| purchases                                        |
+−−−−−−−−−−−−−−−−−−−−−−−−−−−−−−−−−−−−−−−−−−−−−−−−−−+

+−−−−−−−−−−−−−−−−−−−−−−−−−−−−−−−−−−−−−−−−+
| Digital Forecast                       |
+−−−−−−−−−−−−−−−−−−−−−−−−−−−−−−−−−−−−−−−−−−−−−−−−−−−−−−+
|                 |             |          | Sales Per |
|                 |             | Software |  Software |
|                 |       Sales |    Units |      Unit |
+−−−−−−−−−−−−−−−−−−−−−−−−−−−−−−−−−−−−−−−−−−−−−−−−−−−−−−+
|FY3/2023 Forecast|    ¥73,400M |    32.5M |    ¥2,258 |
+−−−−−−−−−−−−−−−−−−−−−−−−−−−−−−−−−−−−−−−−−−−−−−−−−−−−−−+
| FCST Revision 1 |    ¥78,800M |      36M |    ¥2,189 |
+−−−−−−−−−−−−−−−−−−−−−−−−−−−−−−−−−−−−−−−−−−−−−−−−−−−−−−+
|FY3/2024 Forecast|    ¥90,900M |    42.5M |    ¥2,139 |
+======================================================+
| *Sales includes: - Downloadable content          |
| purchases                                        |
+−−−−−−−−−−−−−−−−−−−−−−−−−−−−−−−−−−−−−−−−−−−−−−−−−−+
Since it is the end of FY3/2023, that means Special Page Data:
Consolidated Operating Results (Cumulative):
Code:
+−−−−−−−−−−−−−−−−−−+
| CAPCOM Co., Ltd. |
+−−−−−−−−−−−−−−−−−−−−−−−−−−−−−−−−−+
| Consolidated Financial Results  |
+−−−−−−−−−−−−−−−−−−−−−−−−−−−−−−−−−+
| Data as of March 31st, 2023 |
+−−−−−−−−−−−−−−−−−−−−−−−−−−−−−+
+−−−−−−−−−−−−−−−−−−−−−−−−−−−−−−−−−−−+
| Net Sales                         |
+−−−−−−−−−−−−−−−−−−−−−−−−−−−−−−−−−−−+
| FY3/1998 Cumulative |    ¥58,201M |
| FY3/1999 Cumulative |    ¥38,366M |
| FY3/2000 Cumulative |    ¥51,574M |
| FY3/2001 Cumulative |    ¥49,082M |
| FY3/2002 Cumulative |    ¥62,742M |
| FY3/2003 Cumulative |    ¥62,036M |
| FY3/2004 Cumulative |    ¥52,668M |
| FY3/2005 Cumulative |    ¥65,895M |
| FY3/2006 Cumulative |    ¥70,253M |
| FY3/2007 Cumulative |    ¥74,542M |
| FY3/2008 Cumulative |    ¥83,097M |
| FY3/2009 Cumulative |    ¥91,878M |
| FY3/2010 Cumulative |    ¥66,837M |
| FY3/2011 Cumulative |    ¥97,716M |
| FY3/2012 Cumulative |    ¥82,065M |
| FY3/2013 Cumulative |    ¥94,075M |
| FY3/2014 Cumulative |   ¥102,200M |
| FY3/2015 Cumulative |    ¥64,277M |
| FY3/2016 Cumulative |    ¥77,021M |
| FY3/2017 Cumulative |    ¥87,170M |
| FY3/2018 Cumulative |    ¥94,515M |
| FY3/2019 Cumulative |   ¥100,031M |
| FY3/2020 Cumulative |    ¥81,591M |
| FY3/2021 Cumulative |    ¥95,308M |
| FY3/2022 Cumulative |   ¥110,054M |
| FY3/2023 Cumulative |   ¥125,930M |
+−−−−−−−−−−−−−−−−−−−−−−−−−−−−−−−−−−−+
| Count            |             26 |
| Sum              |    ¥2,039,124M |
| Average          |       ¥78,428M |
| Median           |       ¥79,306M |
| Minimum          |       ¥38,366M |
| Maximum          |      ¥125,930M |
+−−−−−−−−−−−−−−−−−−−−−−−−−−−−−−−−−−−+
+−−−−−−−−−−−−−−−−−−−−−−−−−−−−−−−−−−−+
| Operating Income                  |
+−−−−−−−−−−−−−−−−−−−−−−−−−−−−−−−−−−−+
| FY3/1998 Cumulative |    ¥10,423M |
| FY3/1999 Cumulative |     ¥3,611M |
| FY3/2000 Cumulative |     ¥9,061M |
| FY3/2001 Cumulative |     ¥7,155M |
| FY3/2002 Cumulative |     ¥9,727M |
| FY3/2003 Cumulative |     ¥6,680M |
| FY3/2004 Cumulative |     ¥1,402M |
| FY3/2005 Cumulative |     ¥7,752M |
| FY3/2006 Cumulative |     ¥6,580M |
| FY3/2007 Cumulative |     ¥9,602M |
| FY3/2008 Cumulative |    ¥13,121M |
| FY3/2009 Cumulative |    ¥14,618M |
| FY3/2010 Cumulative |     ¥5,587M |
| FY3/2011 Cumulative |    ¥14,295M |
| FY3/2012 Cumulative |    ¥12,318M |
| FY3/2013 Cumulative |    ¥10,151M |
| FY3/2014 Cumulative |    ¥10,299M |
| FY3/2015 Cumulative |    ¥10,582M |
| FY3/2016 Cumulative |    ¥12,029M |
| FY3/2017 Cumulative |    ¥13,650M |
| FY3/2018 Cumulative |    ¥16,037M |
| FY3/2019 Cumulative |    ¥18,144M |
| FY3/2020 Cumulative |    ¥22,827M |
| FY3/2021 Cumulative |    ¥34,596M |
| FY3/2022 Cumulative |    ¥42,909M |
| FY3/2023 Cumulative |    ¥50,812M |
+−−−−−−−−−−−−−−−−−−−−−−−−−−−−−−−−−−−+
| Count            |             26 |
| Sum              |      ¥373,968M |
| Average          |       ¥14,383M |
| Median           |       ¥10,503M |
| Minimum          |        ¥1,402M |
| Maximum          |       ¥50,812M |
+−−−−−−−−−−−−−−−−−−−−−−−−−−−−−−−−−−−+
+−−−−−−−−−−−−−−−−−−−−−−−−−−−−−−−−−−−+
| Net Income                        |
+−−−−−−−−−−−−−−−−−−−−−−−−−−−−−−−−−−−+
| FY3/1998 Cumulative |    ¥-4,759M |
| FY3/1999 Cumulative |     ¥1,507M |
| FY3/2000 Cumulative |     ¥9,700M |
| FY3/2001 Cumulative |     ¥6,007M |
| FY3/2002 Cumulative |     ¥4,912M |
| FY3/2003 Cumulative |   ¥-19,598M |
| FY3/2004 Cumulative |    ¥-9,158M |
| FY3/2005 Cumulative |     ¥3,622M |
| FY3/2006 Cumulative |     ¥6,941M |
| FY3/2007 Cumulative |     ¥5,852M |
| FY3/2008 Cumulative |     ¥7,807M |
| FY3/2009 Cumulative |     ¥8,063M |
| FY3/2010 Cumulative |     ¥2,167M |
| FY3/2011 Cumulative |     ¥7,750M |
| FY3/2012 Cumulative |     ¥6,723M |
| FY3/2013 Cumulative |     ¥2,973M |
| FY3/2014 Cumulative |     ¥3,444M |
| FY3/2015 Cumulative |     ¥6,616M |
| FY3/2016 Cumulative |     ¥7,745M |
| FY3/2017 Cumulative |     ¥8,879M |
| FY3/2018 Cumulative |    ¥10,937M |
| FY3/2019 Cumulative |    ¥12,551M |
| FY3/2020 Cumulative |    ¥15,949M |
| FY3/2021 Cumulative |    ¥24,923M |
| FY3/2022 Cumulative |    ¥32,553M |
| FY3/2023 Cumulative |    ¥36,737M |
+−−−−−−−−−−−−−−−−−−−−−−−−−−−−−−−−−−−+
| Count            |             26 |
| Sum              |      ¥200,843M |
| Average          |        ¥7,725M |
| Median           |        ¥6,832M |
| Minimum          |      ¥-19,598M |
| Maximum          |       ¥36,737M |
+−−−−−−−−−−−−−−−−−−−−−−−−−−−−−−−−−−−+
###
Sales Per Software Unit (Cumulative):
Code:
+−−−−−−−−+
| Capcom |
+−−−−−−−−−−−−−−−−−−−−−−−−−−−−−−−−−−+
| Segment Information - Cumulative |
+−−−−−−−−−−−−−−−−−−−−−−−−−−−−−−−−−−+
| Data as of March 31st, 2023 |
+−−−−−−−−−−−−−−−−−−−−−−−−−−−−−+

+−−−−−−−−−−−−−−−−−−−−−−−−−−−−−−−−−−−−−−+
| Digital Contents - Package & Digital |
+−−−−−−−−−−−−−−−−−−−−−−−−−−−−−−−−−−−−−−−−−−−−−−−−−−−+
|              |             |          | Sales Per |
|              |             | Software |  Software |
|              |       Sales |    Units |      Unit |
+−−−−−−−−−−−−−−−−−−−−−−−−−−−−−−−−−−−−−−−−−−−−−−−−−−−+
| FY3/2021 Cml.|     ¥68,800M|     30.1M|    ¥2,286 |
| FY3/2022 Cml.|     ¥83,300M|     32.6M|    ¥2,555 |
| FY3/2023 Cml.|     ¥95,300M|     41.7M|    ¥2,285 |
+−−−−−−−−−−−−−−−−−−−−−−−−−−−−−−−−−−−−−−−−−−−−−−−−−−−+
| Count        |           3 |          |           |
| Sum          |   ¥247,400M |   104.4M |    ¥7,126 |
| Average      |    ¥82,467M |   34.80M |    ¥2,375 |
| Median       |    ¥83,300M |   32.60M |    ¥2,286 |
| Minimum      |    ¥68,800M |    30.1M |    ¥2,285 |
| Maximum      |    ¥95,300M |    41.7M |    ¥2,555 |
+−−−−−−−−−−−−−−−−−−−−−−−−−−−−−−−−−−−−−−−−−−−−−−−−−−−+
| *Sales includes: - Downloadable content purchases |
+−−−−−−−−−−−−−−−−−−−−−−−−−−−−−−−−−−−−−−−−−−−−−−−−−−−+
+−−−−−−−−−+
| Digital |
+−−−−−−−−−−−−−−−−−−−−−−−−−−−−−−−−−−−−−−−−−−−−−−−−−−−+
|              |             |          | Sales Per |
|              |             | Software |  Software |
|              |       Sales |    Units |      Unit |
+−−−−−−−−−−−−−−−−−−−−−−−−−−−−−−−−−−−−−−−−−−−−−−−−−−−+
| FY3/2021 Cml.|     ¥48,000M|    23.15M|    ¥2,073 |
| FY3/2022 Cml.|     ¥53,300M|     24.6M|    ¥2,167 |
| FY3/2023 Cml.|     ¥77,300M|     37.3M|    ¥2,072 |
+−−−−−−−−−−−−−−−−−−−−−−−−−−−−−−−−−−−−−−−−−−−−−−−−−−−+
| Count        |           3 |          |           |
| Sum          |   ¥178,600M |   85.05M |    ¥6,312 |
| Average      |    ¥59,533M |   28.35M |    ¥2,104 |
| Median       |    ¥53,300M |   24.60M |    ¥2,073 |
| Minimum      |    ¥48,000M |   23.15M |    ¥2,072 |
| Maximum      |    ¥77,300M |    37.3M |    ¥2,167 |
+−−−−−−−−−−−−−−−−−−−−−−−−−−−−−−−−−−−−−−−−−−−−−−−−−−−+
| *Sales includes: - Downloadable content purchases |
+−−−−−−−−−−−−−−−−−−−−−−−−−−−−−−−−−−−−−−−−−−−−−−−−−−−+
+−−−−−−−−−+
| Package |
+−−−−−−−−−−−−−−−−−−−−−−−−−−−−−−−−−−−−−−−−−−−−−−−−−−−+
|              |             |          | Sales Per |
|              |             | Software |  Software |
|              |       Sales |    Units |      Unit |
+−−−−−−−−−−−−−−−−−−−−−−−−−−−−−−−−−−−−−−−−−−−−−−−−−−−+
| FY3/2021 Cml.|     ¥20,800M|     6.95M|    ¥2,993 |
| FY3/2022 Cml.|     ¥30,000M|        8M|    ¥3,750 |
| FY3/2023 Cml.|     ¥18,000M|      4.4M|    ¥4,091 |
+−−−−−−−−−−−−−−−−−−−−−−−−−−−−−−−−−−−−−−−−−−−−−−−−−−−+
| Count        |           3 |          |           |
| Sum          |    ¥68,800M |   19.35M |   ¥10,834 |
| Average      |    ¥22,933M |    6.45M |    ¥3,611 |
| Median       |    ¥20,800M |    6.95M |    ¥3,750 |
| Minimum      |    ¥18,000M |     4.4M |    ¥2,993 |
| Maximum      |    ¥30,000M |       8M |    ¥4,091 |
+−−−−−−−−−−−−−−−−−−−−−−−−−−−−−−−−−−−−−−−−−−−−−−−−−−−+Another incredible year for Capcom. Highest in revenue and profit, long streaks for both.
Their next FY doesn't look as rich but they probably have 1/2 aces on their sleeves.
Their next FY doesn't look as rich but they probably have 1/2 aces on their sleeves.
Another incredible year for Capcom. Highest in revenue and profit, long streaks for both.
Their next FY doesn't look as rich but they probably have 1/2 aces on their sleeves.
Yeah Capcom is killing it.
They are also forecasting a increase in revenue/profit next year, and 9.3M units sold for new titles. Last year they aimed for 10M but ended up beating that forecast selling 12.4M instead.
I'm assuming they'll announce a release date this summer for another project releasing within this fiscal year, because I don't think they are hitting those numbers with the titles they have planned atm. So either Pragmata, Dragon's Dogma 2 or something new.